Report Server
Report Server | Introduction
The Server Edition makes it easy to create and deploy report applications to the web.
Using basic component configuration you can get a Windows service-based report server application up and running, a web application up and running, and have users previewing reports in a web browser in no time. And you can do it all without having to master multi-threaded programming, Windows Services, Windows Sockets, Windows System Tray applications, COM, I/O Completion Ports/Worker Thread Pools, XML, SOAP Services, ISAPI Thread Pools, XHTML, or JavaScript.
Report Server
Web Tier
Client Support
Report Server | Architecture
ReportBuilder Services
ReportBuilder Services is a Windows service designed to act as a host to a report server application. This two-piece architecture isolates a report server application in its own process, allowing it to be started and stopped from the service. By default, the service is configured to start automatically each time the server machine boots. Once the service is started, it launches the report server application. The service is also configured to automatically restart the report server application in the event of a crash.
To install ReportBuilder Services, you simply run the included RBWinService.exe installation program. The program installs and starts the Windows service and deploys a server management application, accessible from both a system tray icon and a Start menu item. You can then access the management application and point the Windows service to the location of your report server application.
Report Server Component
The Report Server component implements a multi-threaded report server that can execute reports and deliver report pages to clients. You build a report server application by dropping a ReportServer component on a Delphi form, creating data modules which contain ReportVolume components (explained next) and compiling the application. And that’s it; you can build an entire server application without writing any code. Once the application is built you can then use ReportBuilder Services to quickly and easily designate it as the official report server. The Report Server is implemented using an I/O completion port/worker thread architecture that optimally manages persistent report sessions to maximize performance and throughput. The server can generate reports incrementally (that is, page-by-page) in order to optimize response time. Pages are cached on the server and on the client to minimize network traffic. The amount of time that passes before a session expires (and the cache is cleared) can be controlled via the TimeOut property.
Report Volume Components
Report Volume components are used to register a collection of reports with the server. The server uses a report catalog to build and store the tree structure which forms as the various reports are registered.
There are several types of report volume components, one for each of the ways that reports are most commonly deployed. For report templates stored in file directories or database tables, there is the ReportTemplateVolume. For reports stored in the Explorer database structure (i.e. RB end-user reports), there is the ReportExplorerVolume. For report archives stored in file directories or database tables, there is the ReportArchiveVolume. For reports stored on a Delphi form, there is the “behind-the-scenes” report volume object. The bottom-line: wherever or however your reports are deployed, there is a simple way to register them with the server, usually without writing a single-line of code.
Report volumes are also dynamic; as you add reports to a designated file directory or database storage medium, the report server will automatically add or remove those reports from the catalog. Yes, this does mean that you can deploy reports to the server without bringing the server down.
Report volumes are also dynamic; as you add reports to a designated file directory or database storage medium, the report server will automatically add or remove those reports from the catalog. Yes, this does mean that you can deploy reports to the server without bringing the server down.
ReportBuilder ISAPI Thread Pool
The Server Edition includes a custom ISAPI thread pool, implemented using an I/O completion port/worker thread architecture designed to optimally manage incoming requests. The thread pool queues requests based on session, and can eliminate redundant requests. This greatly improves both throughput and performance, as the web tier passes only relevant requests through to the report server application.
Server Farm
The web tier can be configured to utilize any number of report servers to maximize scalability. This allows the web tier to scale gracefully as a greater number of users access reports. There are two load balancing options provided: Round Robin and Minimum Load. Round Robin simply steps through a list of servers, each time returning the next server in the list. Minimum Load checks the CPU usage of each server (based on a sixty second moving average), and returns the server with the minimum usage.
Windows Rich Client Components
With one ClientReportExplorer, one ClientReport, and one line of code, you can build a full-featured Delphi reporting application which provides access to reports on a remote server. The ClientReportExplorer uses a Windows Explorer style interface to display a folder tree structure of available reports. The ClientReport makes it easy to preview and print. When previewing a report that requires search criteria, the AutoSearch dialog is automatically displayed and any search values entered are returned to the server. The report is then generated and pages are returned.
WebTier Component
When compiled as part of a web application, the web tier acts as a middle tier, providing access to a report server application from a web browser. A user may select reports from a folder tree structure, enter search criteria when applicable and preview report pages from the web browser. All of these capabilities are made possible via a zero-client application (100% JavaScript/XHTML) generated by the web tier. The zero-client is compatible with Netscape 4, Netscape 6, and Internet Explorer (5 and 6.)
Designed to integrate seamlessly with Delphi’s various web technologies, the web tier requires only a single line of code to compile successfully as part of an ISAPI DLL or Apache Shared Module. ASP is also a snap, as a single COM interface (easily generated with the help of Delphi’s ActiveX support) is all that is needed to deploy the web tier as part of an Active Server Page.
The web tier implements a sophisticated concept of “session”, grouping all of the communications received from a single web browser under a single session object. In order to optimize performance, both the state of the session, and any report output generated for the session are cached. For example, assume a user previews report A, then report B, then returns again to report A. The web tier would manage all of this activity as a single session, and whenever possible, would return pages from the session cache, instead of re-requesting them from the report server application. The amount of caching which occurs, the TimeOut for a session and the frequency with which garbage collection is performed on expired sessions are just a few of the configuration options available on the web tier.
Implemented as a set of Delphi classes, the WebTier consists primarily of objects which descend from TrsWebContentProvider. Web content providers communicate with the report server application, converting the response from SOAP/XML to native Delphi objects to XHTML/JavaScript, suitable for consumption by a web browser. The content providers included in the Server Edition make it easy to provide a complete, robust, and professional web reporting solution right out of the box. You can customize the HTML created by the web tier by creating your own content provider descendants.
Documentation, Help & Examples
The Server Edition Developer’s Guide is provided in PDF format. The concepts behind the web server are covered, along with numerous step-by-step tutorials that guide you through everything from creating a report server application to deploying the web tier with a server farm. The online help is a reference for all of the components and major classes which make up the product. The help is integrated with the Delphi help and is accessible via the help menu or the F1 key. Numerous examples of report server applications, web applications and client applications are also provided.
The following components appear on the RBServer tab of the Delphi component palette when you install ReportBuilder Server:
| Component | Icon | Description |
|---|---|---|
| Report Server | Used to create a report server application. Encapsulates all of the functionality required to communicate with remote clients and execute reports on their behalf. | |
| Web Tier | Used to build web based reporting solutions. The web tier acts as a middle tier between web browser clients and the report server. It enables web browser clients to request and view reports generated by a report server application. | |
| Report Archive Volume | Represents a collection of report archives on the server. Used in a server application to enable clients to preview and print a collection of report archives. Dynamically generates catalog items for archives stored in a file directory structure or database table. | |
| Report Template Volume | Represents a collection of report templates on the server. The report templates may be stored in .rtm files or a database table. Used in a server application to enable clients to preview and print a collection of report templates. | |
| Report Explorer Volume | Represents a collection of reports stored in the report explorer database tables. Used in a server application to enable clients to preview and print a collection of reports stored in report explorer database tables. | |
| Client Report | A report component that communicates with a report server. Contains many of the same properties and methods that are used to print and preview via a standard TppReport component. | |
| Client Report Explorer | Provides a user-interface that enables client applications to browse, preview, and print reports residing on a report server. The interface is very similar to the Windows Explorer and to the TppReportExplorer used to build end-user applications. |
Report Server | FAQs
Do I have to change all of my reports to get them to work on the server?
No. But you do have to provide thread-safe containers for the database connection components needed by your reports. That may sound scary, but it’s really no big deal. The documentation for the Server Edition will include directions for creating thread-safe containers for all of the popular database/connectivity product combinations. These containers can be Delphi data modules or invisible forms and should be configured with the appropriate Volume components or direct registration calls. Through the registration process you associate containers with reports so that the reports can successfully connect to a database when loaded. Report related event-handler code must also be thread-safe. However, unless you are referencing global objects or resources that exist outside the context of the container form or datamodule, then the code is probably thread-safe as is.
How hard is it to get the server up and running?
It is very easy. The Server component encapsulates all of the functionality required to communicate with clients and execute reports on their behalf. Your primary task will be registering your reports with the server’s report catalog. If the reports are deployed as components on Delphi forms or in data modules, this requires a simple registration call to the report catalog. If the reports are deployed as report templates, as report archives, or as report templates in the end-user database structure it is even simpler. You can connect one of the Volume components to the file directory structure or the database tables and it will dynamically generate catalog items for all of the reports residing in the structure. Using this latter scheme you can add and remove reports without bringing the server down.
How many users can practically be served at once?
It depends. A report based on a simple query, which retrieves few records and generates few pages can be run by many users at once. A report which utilizes multiple complex queries, pulls millions of records and generates tens of thousands of pages may be all the server can handle at any one time. The best way to determine the answer to this question is to create a report server with your reports and see how it goes. You have lots of options regarding live report vs. archive report, full generation vs. incremental generation and caching configuration options on both the report server and the web tier. There is also multiple CPU and multiple server configurations to consider.
How fast is the server?
Just as fast as ReportBuilder, but certainly no faster. Remember that directory structures (folder trees), search criteria, and page objects must be sent across the wire to the client. This takes additional time. Yes, the messages are compressed. Yes, multi-threading means that the messages will be processed in a timely fashion. But there are many, many factors which control the performance any given user may experience. The best bet is to test the server using your reports and your client application.
How do I stop a ‘runaway report’ on the server?
The Volume.PublishingOptions can be used to specify the maximum number of pages and maximum number of seconds for report execution. These values can be used as the defaults for all reports in the volume. The Volume.OnGetPublishingOptions event can be used to dynamically set the publishing options for individual reports.
Proper use of the Volume.PublishingOptions should prevent runaway reports. However, in the event of a runaway report, you will need to stop the service or (if you are running the server in stand-alone mode) shut down the server application. A future version of the Server Edition may contain an administrative application where you can stop individual sessions – but for now we are focused on solidifying a fast, stable and scalable core.
What happens if the server crashes?
When configured correctly, the server will simply clean up after itself and automatically restart. This is why you should deploy your server application using the Windows Service scheme. Under this scheme if the server crashes, the Windows Service can automatically restart the application. The server application is running in its’ own process space – which means that other applications on the same machine should not be affected if the server crashes. For reasons of both performance and stability, you should also run your web tier as an Isolated Process. This keeps other ISAPI DLLs on your web server from crashing your web tier and vice versa. Of course, when a crash does occur, the exception will be logged – so you should be able to isolate the report causing the problem.
Does the server do any kind of logging?
Yes. Both the report server application and the web tier will automatically log any exceptions (unless logging is turned off.) The web tier also has a ‘verbose’ mode where it logs every request, every response, every run of the garbage collector and every exception. By default this verbose mode is turned off, because logging adversely affects performance. The log format can be set to ASCII text or XML.
What web browsers are supported?
Internet Explorer, Chrome, Safari and more. The JavaScript versions of the report explorer and report viewer are remarkably Windows-like under most browsers.
Can I hot-swap reports running on the server?
Yes and no. You can replace a report template or archive in a registered directory, provided that the template or archive is not currently being loaded. You cannot seek out and kill an active session involving the replaced report and then restart the session to its last point of progress. Of course, changing reports which are compiled directly into the server application requires that the server be stopped and replaced with the new executable containing the new reports. This is why the TemplateVolume, the ArchiveVolume and the ExplorerVolume components are probably better than direct registration of report components – these volumes specify locations and allow you to change the reports available at those locations without bringing down the server.
Can I administer the server remotely?
Yes. Using PCAnywhere or the remote capabilities of Windows 2000/XP, you can run the RB Services Manager. The RB Services Manager is available from the Start Menu, under ReportBuilder | Services Manager. It is a system tray based application which allows you to start/stop the report server or change the location of the server app (if you need to move the app to a different directory.) The RB Services Manager is available only when the server is deployed as a Windows Service.
How is printing handled from the web browser?
HTML does not print well – it just wasn’t designed for it. And while web browsers have made some progress in this area, the sophisticated content possible with ReportBuilder is often too much for them. The best answer at this point appears to be PDF. PDF is designed for printing, and the Acrobat Reader plug-in is just about ubiquitous. ReportBuilder fully supports advanced PDF export built into the product.
Does the server support https?
Yes. Not only can you secure the web tier so that it is only accessible via https, you can configure RB thin-client components so that they talk to the web tier instead of the report server, making thin-client communications secure.
Does the server provide encryption?
The first version of the server does not include encryption. One solution is to use HTTPS to communicate between clients and the WebTier. Then deploy the Server and the WebTier on the same machine or perhaps run the Server application on a separate machine behind your firewall.
Can I provide a login and user name before users get access to the reports?
Yes. The Server Edition includes support for adding session level and report level parameters. Examples are included that show how to implement a custom login form and restrict access to reports based upon login information.
Can Server run on Linux?
No. While the report engine inside the server application is functioning without a user-interface, many dependencies on the Windows Operating System (and the associated API) still exist. We consider a Linux server to be a mammoth undertaking and are not committing to such a project at this time.
Can I use the Server Edition with WebBroker, WebSnap, or IntraWeb?
To date, we have created example applications using Delphi’s WebBroker, and Active Server Object technologies. Keep in mind that the Server Edition’s WebTier component contains all of the functionality required to process web requests, cache session information, and generate fully functional HMTL/JavaScript applications. Therefore, it may be that you need only integrate the output of the Server Edition with the output of these other tools in order to get a complete solution (i.e. we know how difficult it was to code the Report Explorer and the Report Viewer in JavaScript; we would hate to see you have to duplicate that effort unnecessarily.)
Can I use the Server Edition to build ISAPI, ASP, and Apache applications?
The Server Edition leverages Delphi’s ability to build several types of web applications. The WebTier component can be included in a Delphi WebBroker application, WebSnap application, or Active Server Object. The Server Edition includes examples of using each of these technologies to build web applications.
Is the Server Edition royalty-free?
No. The Server Edition provides deployment licenses which allow you to run a server application on a single CPU. If you decide to run the application on a machine with multiple CPUs then you will need to purchase one deployment license for each CPU. The Server Edition includes one server development license and one server deployment license. Each deployment license is ‘unlimited-user’, you can run as many users against any given server as you like.
How much does it cost?
The Server Edition is US $1259 – and that includes everything in the Enterprise Edition, the Server Edition components, one server development license, and one server deployment license. The Enterprise Edition already costs $996 – so you are basically getting all of the Server Edition technology for $263. Considering that additional deployment licenses are only $299, and that each license allows you to run unlimited users against the server, it’s probably the most cost effective solution out there.
Do I need to buy both the Server Edition and the Enterprise Edition?
No. The Server Edition includes the Enterprise Edition, so you’ll have all of the tools you need to both create reports and deploy them to the web.
Report Server | Licensing
ReportBuilder Server Edition currently includes a single developer license for ReportBuilder Enterprise and a single developer license to ReportBuilder Server. Also included is a Server Deployment license for a single CPU. This enables you to install a report server solution to a single CPU machine. Additional Server Deployment licenses are US $299.00 per CPU. Thus to deploy a server solution to a dual processor machine requires two deployment licenses. A report server can support as many clients as the hardware will allow. In summary, the licensing is per server CPU, not per client seat.
Report Server | Live Demo
RAP
RAP (Report Application Pascal) and the integrated development environment that can be used to create RAP programs are the result of the discovery that a visual solution for data processing and calculation was needed for end users. Even though RAP consists of an object-oriented compiler and extensible architecture ‘under the covers’, it appears as a simple, easy-to-use calc workspace within the Report Designer.
The Report Application Programming language (or RAP for short) is designed to allow developers and end users to code calculations, event handlers, and stand-alone procedures for use with ReportBuilder Enterprise. RAP programs can be created, modified, compiled, and executed at run-time.
RAP is easy to learn.
The RAP language is identical to Object Pascal. If you know how to code Delphi event handlers, you know how to code RAP. Therefore, the ‘learning curve’ for Delphi developers will be minimal.
RAP lets you work with objects and object properties.
RAP provides full access to the report, bands, groups, report components, datapipelines, and any other objects you wish to pass along to the end user. New objects can be created. Both the published and public properties of objects are accessible, so end users can configure objects on-the-fly.
RAP is Portable Code.
RAP allows you to store code with your reports. Until now, ReportBuilder’s powerful events have been available only within Delphi. If you wanted to load reports at runtime and retain any event handlers, you had to load the report into a form or datamodule which contained correctly named procedures in order to ensure that the loaded report “hooked up” successfully to the event handlers. Now, with RAP, you can code your event handlers within the Calc workspace and then save them as part of the report in an RTM file. When you load a report from an RTM or from a database, your event handlers are loaded as well and are already “hooked up”.
RAP is EndUser Programming.
RAP allows your users to create their own calculations with their reports. ReportBuilder’s award winning end user solution was already powerful, allowing your users to edit or create new reports, but RAP extends the solution by giving end users the ability to code their own event handlers and extended calculations. The Calc workspace is an Object Pascal development environment that is designed for ease of use by non-developers. The Code Explorer offers varied views of the report code module; the Code Editor is a syntax-sensitive Pascal editor; the Code Toolbox serves double duty, providing both a partial list of supported identifiers as well as a drag & drop code creation facility.
RAP has a scalable user-interface.
1. For casual end users, a simple Calculations dialog is accessible from the speed menu of the new TppVariable component. This dialog provides a place for calculations to be entered and returned via a single Result parameter. The calculation result is then displayed in the variable when the report prints.
2. For more sophisticated users, RAP can be configured to display as an additional tab in the Report Designer. The new ‘Calc’ tab shows the bands of the report in a tree view, along with the associated variables. The end user can click on the variables and code the calculation in a syntax-sensitive edit window.
3. The highest level of functionality is provided by the ‘Event’ view. This capability shows all of the report components in a tree view. When a component is selected, all of the events for the component are displayed. The user can then select an event and code an event handler.
RAP is extensible.
RAP is delivered standard with the ability to compile the most often used ReportBuilder and Delphi objects. If you want end users to access more than this, you can register additional RTTI information with RAP. RAP will then be able to compile your custom components. You can also extend the language by adding new ‘built-in’ functions and procedures which the users can call from their RAP programs. These procedures are written and compiled in Object Pascal and then registered with RAP.
RAP is cool.
The wide feature set, object-based functionality, and professional user-interface makes RAP the language to beat for reporting applications.
The RAP user interface can be configured to meet the needs of your end users. There are three basic configurations available:
1. Calculations Dialog
For casual end users, a simple Calculations dialog is accessible from the speedmenu of the new TppVariable component. This dialog provides a place for calculations to be entered and returned via a single Result parameter. The calculation result is then displayed in the variable when the report prints.
In order to configure the user-interface to provide this level of functionality, set the RAPInterface riNotebookTab property to False and the riDialog property to True. The figure below illustrates the Calculations… option available when the end user accesses the speed menu of a variable.
When this option is selected, the Calculation dialog is displayed. The end user can then create code to assign the value of the variable.

2. Calc Tab with Variables
For more sophisticated users, RAP can be configured to display as an additional tab in the Report Designer. The new ‘Calc’ tab shows the bands of the report in a tree view, along with the associated variables. The end user can click on the variables and code the calculation in a syntax-sensitive edit window.
In order to configure the user-interface to provide this level of functionality, set the RAPInterface riNotebookTab property to True. When the report designer is displayed, the Calc tab will be visible, and the variables within each band will be listed.

3. Calc Tab with All Objects
The highest level of functionality is provided by the ‘Event’ view. This capability shows all of the report components in a tree view. When a component is selected, all of the events for the component are displayed. The user can then select an event and code an event handler.

In order to configure the user-interface to provide this level of functionality, set the RAPInterface riNotebookTab property to True and set all of the RAPOptions to True. When the report designer is displayed, the Calc tab will be visible. By right-clicking on the treeview on the left, a speed menu will be displayed that shows the different views of calculations available:
a. Variables
This view shows the variables in each band of the report.
b. Events
This view shows the report and all of the objects within it. An event handler can be coded for any object.
c. Module
This view shows the global declarations, functions, procedures, and events.
Multi-Dimensional Data Analysis
Multi-dimensional Data Analysis (MDDA) refers to the process of summarizing data across multiple levels (called dimensions) and then presenting the results in a multi-dimensional grid format. This process is also referred to as OLAP, Data Pivot., Decision Cube, and Crosstab.
ReportBuilder’s Crosstab component can be used to perform MDDA. Three types of dimensions can be defined: Column, Row and Value. Column and Row dimensions are used to define summarization levels and Value dimensions are used to specify calculations.
The process of MDDA is best explained via an example. Suppose that our dataset contains the following sales information:
SalesMonth
State
AmountPaid
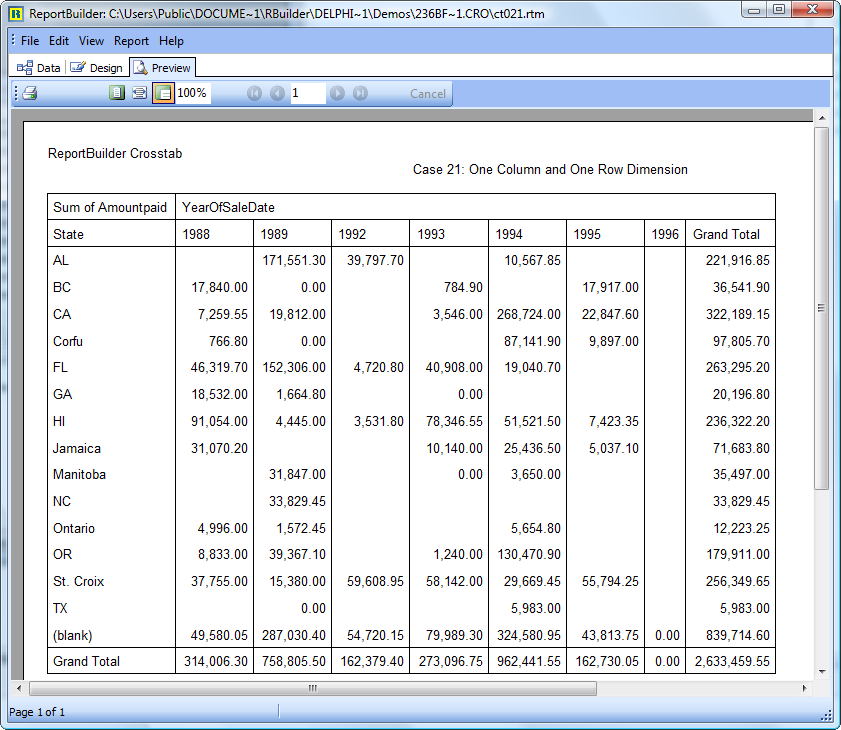
The Crosstab component can be used to produce a grid showing the total, average and number of sales summarized by state for each month. The output of the report is shown below.

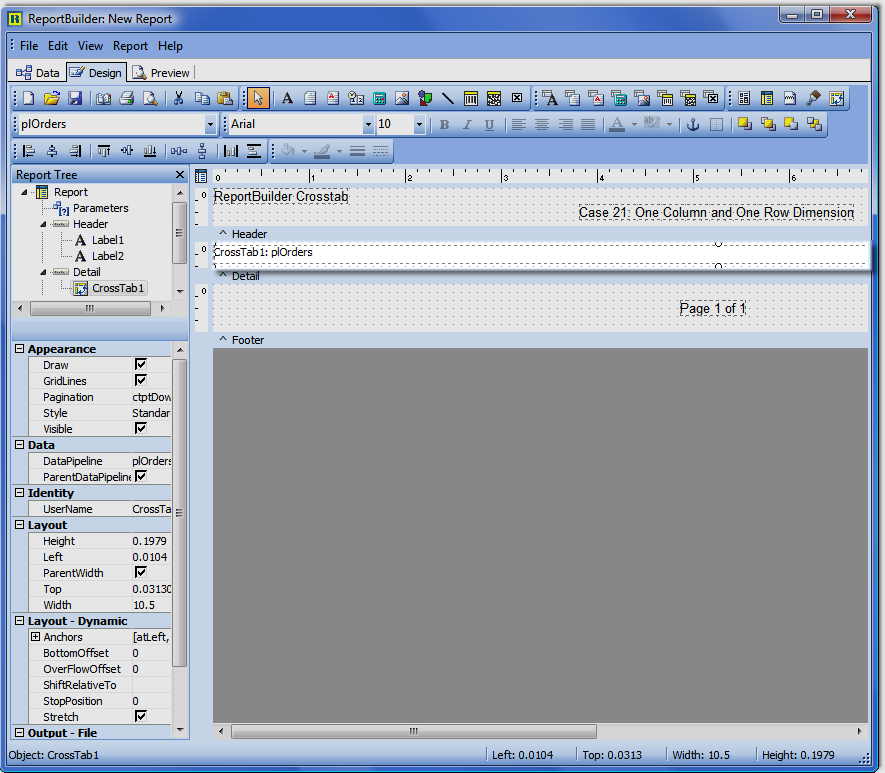
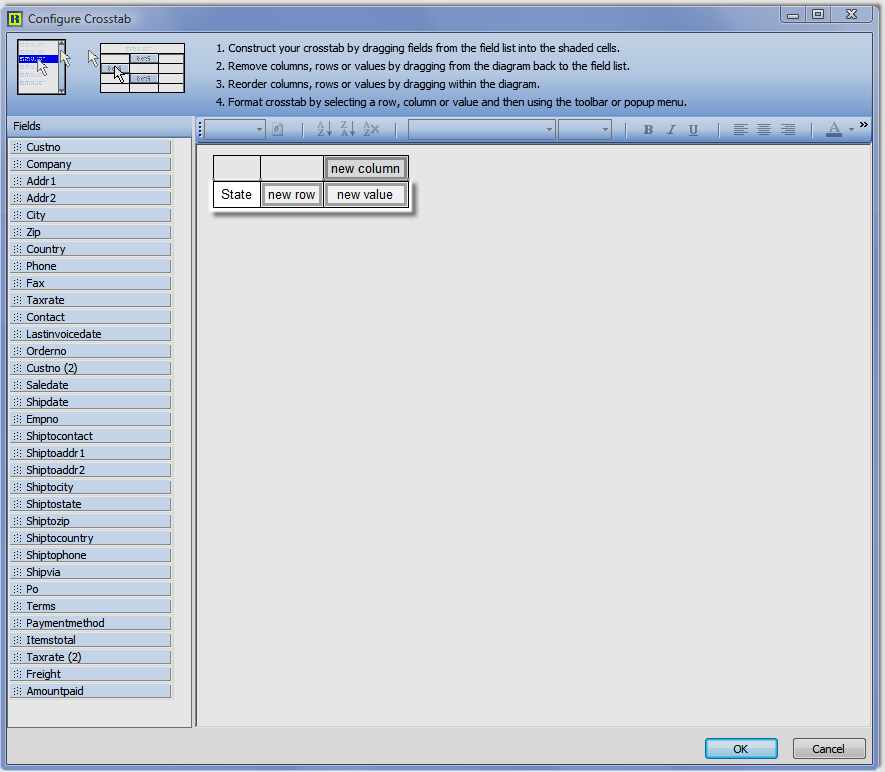
Screenshots of building a crosstab:
1. Add a crosstab to the report
2. Access the crosstab designer
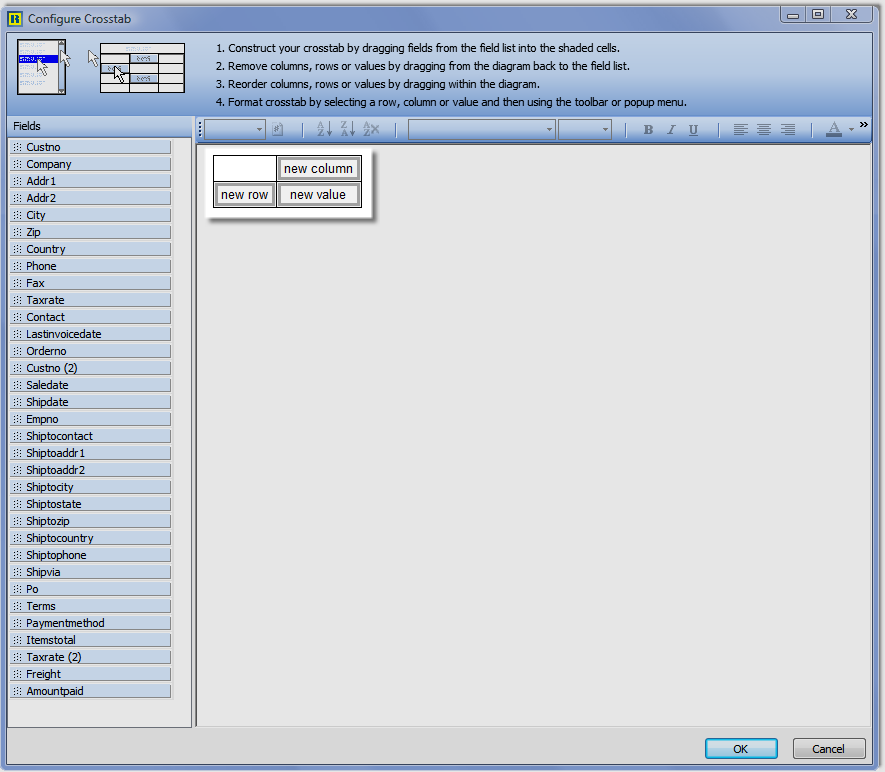
3. Add a row dimension for State
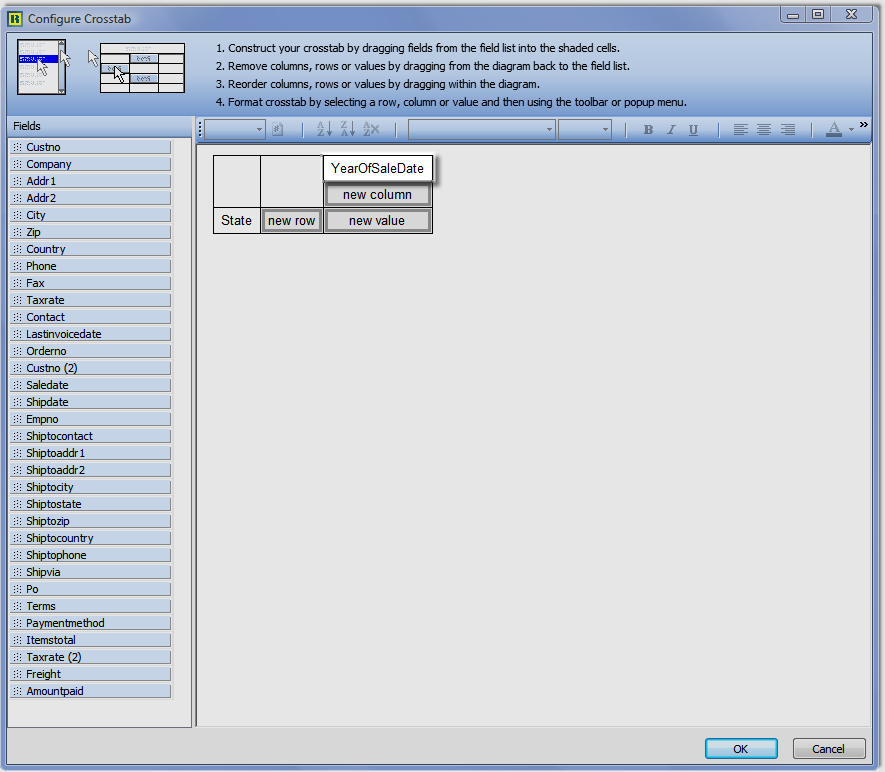
4. Add column dimension for SaleMonth
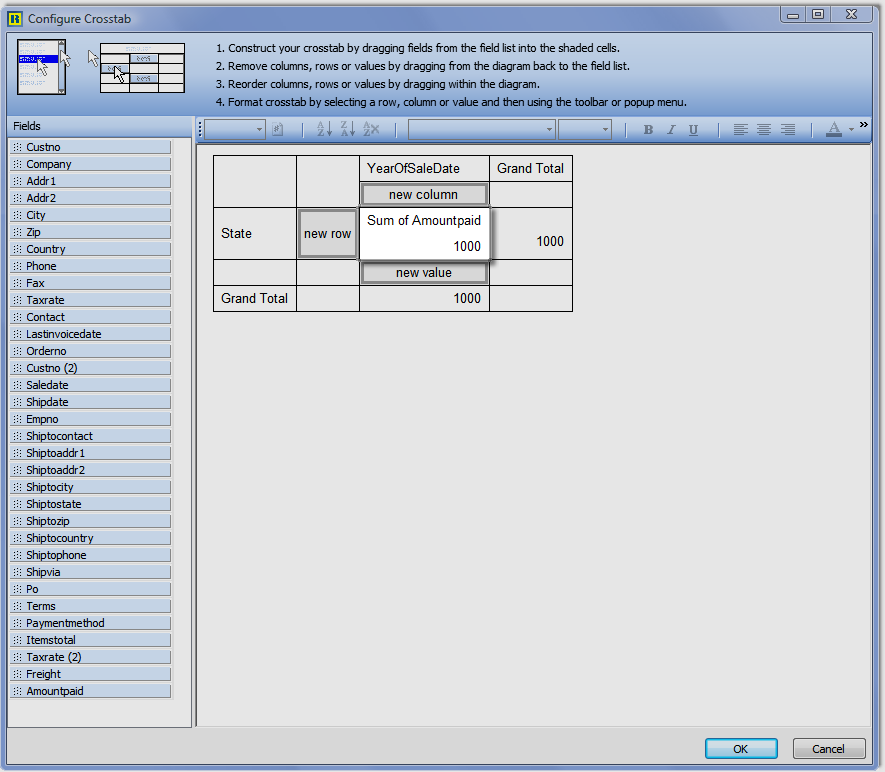
5. Add value dimensions for AmountPaid
6. Preview Report
Visual Data Access
DADE (Data Access Development Environment) is an integrated environment that can be used by developers and end-users to rapidly build queries, link queries, and specify ask at run-time search criteria.
DADE is RAD Data Access.
Data Access Development Environment, or DADE for short, enables developers and end-users to rapidly define the data access elements required by simple and complex reports. These elements typically included queries, master/detail linking relationships between queries and ask at runtime search criteria.
DADE is easy to learn.
DADE provides simple to use Query Wizard and Query Designer tools that do not require the user to know SQL syntax. Linking two queries into a master/detail relationship is as simple dragging the mouse from the detail query datafield to the master query datafield.
DADE is for End-Users and Developers.
DADE includes a DataDictionary that can be used to provide end-users with a simplified view of the database. The DataDictionary can be used to:
DADE adapts to your database.
DADE supports a wide spectrum of database engines and data access component sets. ReportBuilder includes DADE plug-ins that support Delphi’s ADO, IBExpress, dbExpress, and BDE components. Advantage, DBISAM, and DOA (Direct Oracle Access) plug-ins are installed with the demos. Additional DADE plug-ins can be downloaded from the companion products page.
DADE provides portability.
DADE enables the data access elements of a report to be saved as part of the report definition, outside of the application executable. This is contrast to a report that relies on Delphi dataset components that reside on a form or datamodule.
DADE is extensible.
DADE is extensible class library that can be extended in a variety of ways:
Within the data workspace, you can select data from your database using an SQL query. This functionality is provided via query-based dataviews, which can be visually created using the Query Wizard and visually maintained using the Query Designer. The following series of screenshots shows how to create a simple query-based dataview via the Query Wizard.
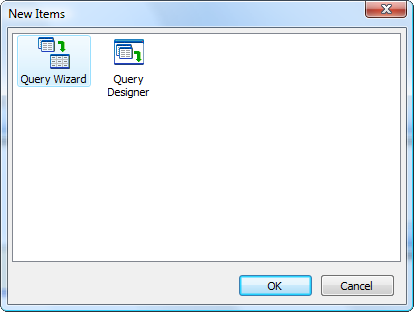
1. Select File | New menu option from within the data workspace. The New Dialog will be displayed. Double-click the Query Wizard icon.
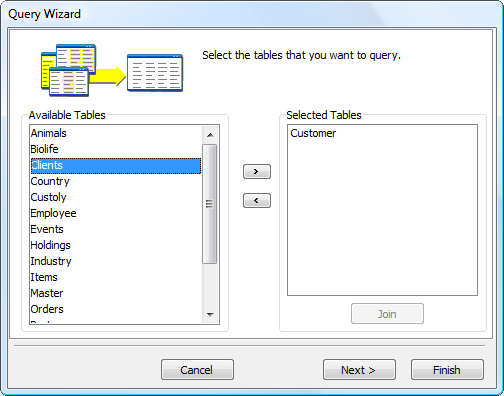
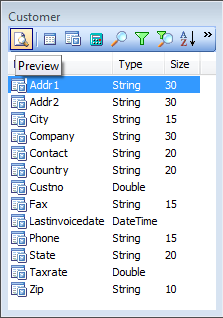
2. Select the first table for the query. The customer table has been selected.
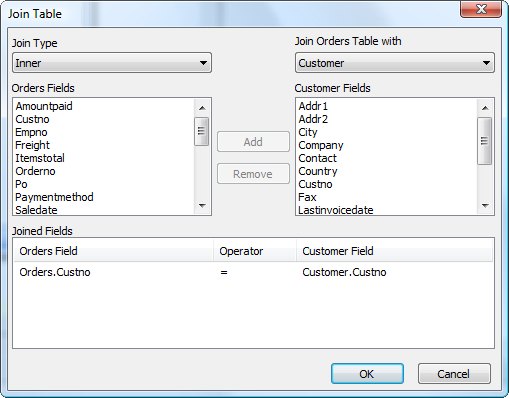
3. Select the second table for the query. The order table has been selected and the Join dialog was automatically displayed. The dialog already contains the correct field linking (Customer No.), so all we have to do is click OK.
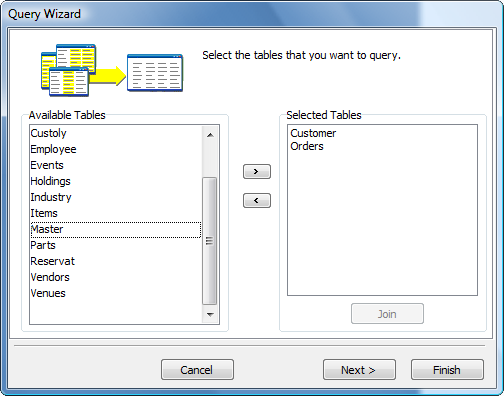
4. When we return to the query wizard, both tables are shown as selected.
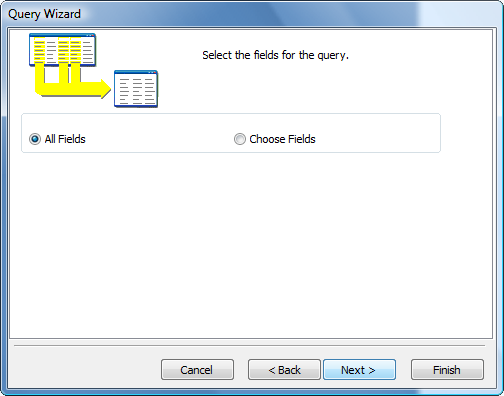
5. Skip the fields page, since we want to select all fields.
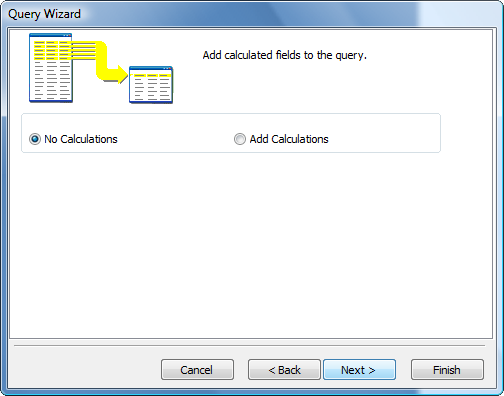
6. Skip the calculations page, since this query will not contain calculations.
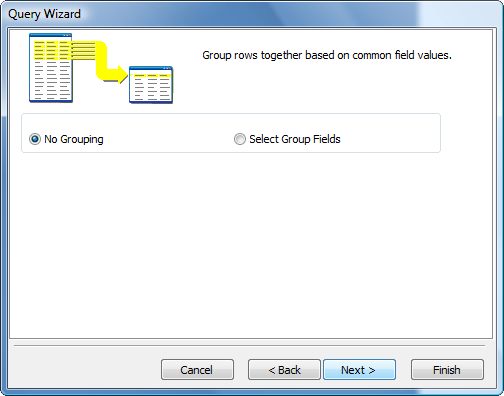
7. Skip the groups page, since this query will not be grouped.
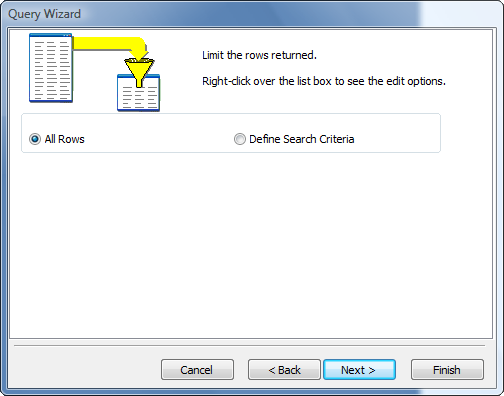
8. Skip the search criteria page; all records will be selected.
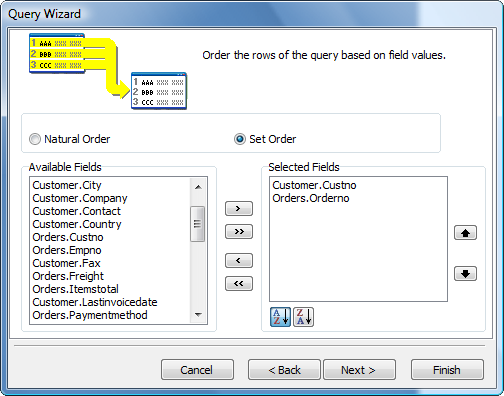
9. Set the order to customer number, then order number.
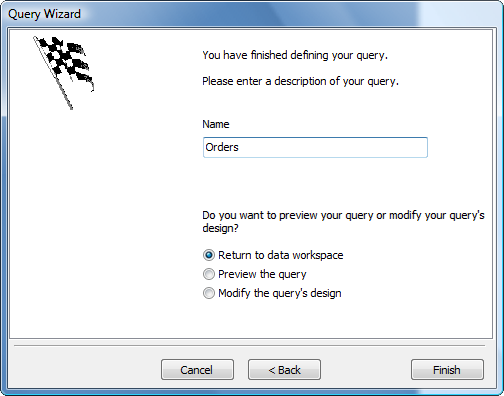
10. Name the dataview. The datapipeline name is automatically generated when we name the dataview. The next action will be to preview the data.
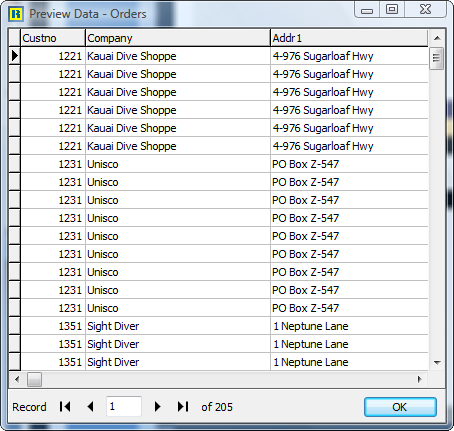
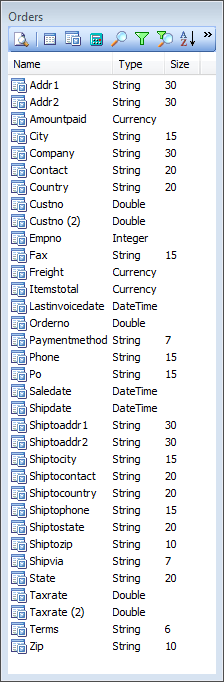
11. View the data to make sure the correct records have been selected.
12. Close the preview window. The dataview is then created and displayed in the workspace.
From here we could proceed to the design workspace where we could create a new report layout based on this dataview either manually or through the use of the Report Wizard.
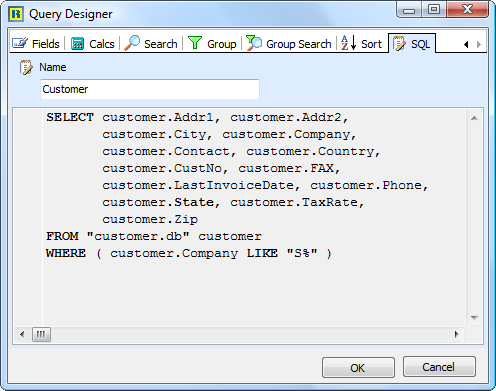
The Query Designer is used to modify query-based dataviews. The query designer presents a series of notebook tabs; each tab represents a different part of the query. The last notebook tab in the Query Designer shows the generated SQL and allows the name of the dataview and datapipeline to be changed. The Query Designer is pictured below.
Adding Search Criteria
You can use the Query Designer to add or remove search criteria from your query. Take these steps in order to add search criteria:
1. Click on the Search icon of the dataview to launch the Query Designer.
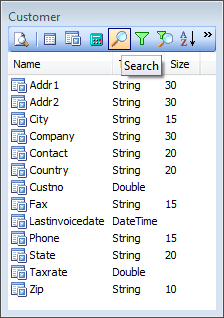
2. From the list of fields at the top of the search page, double-click on the field for which criteria needs to be entered.
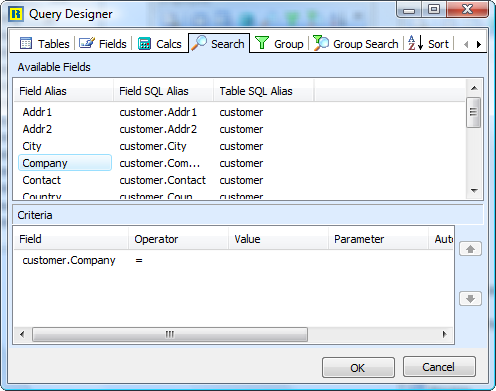
3. Click on the field that has been added to the list of criteria at the bottom and select the operator.
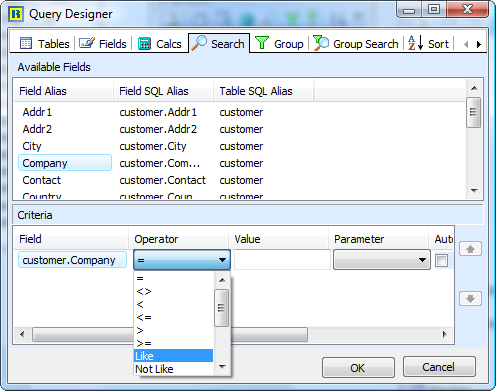
4. Click in the edit box and enter the search criteria value. This criteria will find all company names which begin with the letter ‘S’.
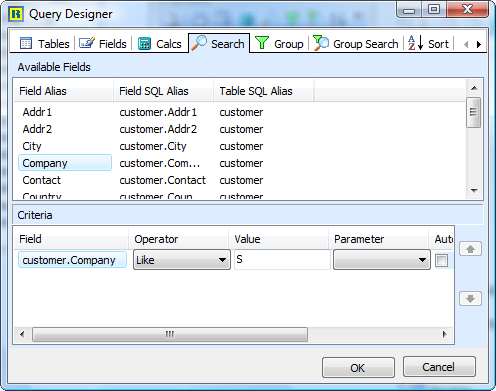
5. Click on the SQL tab to make sure the criteria value is valid.
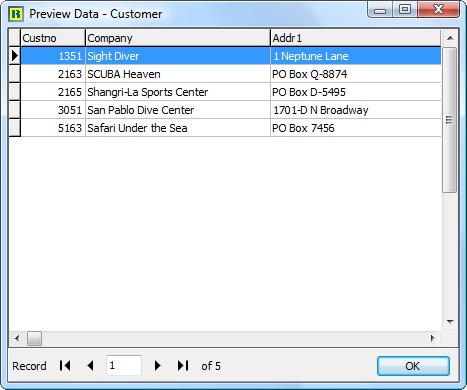
6. Close the Query Designer and click on the preview icon.
7. Preview the data and make sure that the intended records are selected.
The first step in configuring DADE for your end users involves setting the properties of the DataSettings object of the Designer component.This object contains the following properties:
| Object | Description |
|---|---|
| AllowEditSQL | Determines whether or not the end-user can edit the SQL in the Query Designer. |
| DatabaseName | Determines whether or not the end-user can edit the SQL in the Query Designer. |
| DataDictionary | The data dictionary object that will convert raw table and field names to aliases. |
| SessionType | Defaults to BDESession. Should only be changed if you have created your own Session class in order to use the Query Wizard with a proprietary database engine. |
| SQLType | Defaults to sqBDELocal. If you are not using dBase or Paradox tables, then you should set this property to sqSQL1, as the Local SQL dialect is not supported by most other database types. If your database supports ANSI-92 SQL, then you can set this property to sqSQL2 instead of sqSQL1. |
| UseDataDictionary | Determines whether the data dictionary object assigned to the DataDictionary property will be used. |
If you intend to use the Query Wizard and Query Designer, then the SQLType is vital. The following table shows the recommended SQLType for a given database product.
| Database Product | SQLType |
|---|---|
| Paradox | sqBDELocal |
| Interbase | SQL2 |
| Oracle | SQL1 |
| MS Access | SQL2 |
| Sybase SQL Server | SQL1 |
| Sybase SQL Anywhere | SQL2 |
| MS SQL Server | SQL1 |
Once you have configured the data settings, you may notice that a Data Settings menu option appears on the File menu of the data workspace when you run your application. This option displays a dialog that allows the end-user to modify the data settings (pictured below). If you do not want the end-user to be able to change these settings, then you can set the AllowDataSettingsChange property of the Designer component to False.

DADE supports a wide spectrum of database engines and data access component sets. ReportBuilder includes DADE plug-ins that support Delphi’s ADO, IBExpress, dbExpress, and BDE components. Advantage, DBISAM, and DOA (Direct Oracle Access) plug-ins are installed with the demos. Additional DADE plug-ins can be downloaded from the companion products page.
The object model below shows the primary classes used to support the plug-in architecture. The abstract ancestor classes are shown in yellow. The classes shown in blue represent the classes required to support a plug-in.

In this diagram, inheritance relationships are indicated by triangles. Where one class is associated with another class, a line is used. If the line terminates in a diamond shape, then it indicates that the class actually forms part of the internal implementation of the component. For instance, the TdaSQL class is part of the implementation of the TdaQueryDataView. The unit in which each class is declared is indicated by the text at the upper left corner of each containing shape.
Basic Classes
The following classes represent the heart of DADE. By creating descendants of these classes, native support for any database product that supports SQL can be implemented.
| Class | Description |
|---|---|
| TdaDataView | Dataviews represent a set of data and are visually created and maintained in the data workspace of the report designer. Internally, a dataview creates the data access objects necessary to connect a report to data. The interface from the dataview into the other workspaces of the report designer is composed of the data pipelines, which are contained by the dataview. A dataview must have at least one datapipeline. A typical dataview will contain one or more datapipelines, datasources, and datasets. |
| TdaSession | Contains the methods needed by the TdaSQL class when editing (via the Query Wizard and Query Designer) and generating SQL. Provides the table names for a given database name and the database driver name (i.e. ‘Sybase’). |
| TdaDataSet | Contains methods needed by the TdaSQL class for generating SQL. It is used to get the field names for a given table name and to check SQL statements for validity. |
| TdaSQL | This is the main SQL editing and generation class. The Query Wizard, Query Designer, and DataViews rely on this component. As the SQL is designed visually, the SQL component maintains an object-based description of the SQL query. This description is used to generate the SQL. The SQL object is saved as part of query-based dataviews. |
| TdaCustomDataView | This class further defines the dataview API and implements the capability to save the dataview as a set of objects. |
| TdaQueryDataView | This class contains the association to the TdaSQL class. |
Implementation Classes
The following classes are used to implement BDE support within DADE. Non-BDE database products that replace the BDE can also be used with these classes.
| Class | Description |
|---|---|
| TdaBDESession | Passes the method calls of the TdaSession class through to the Delphi Session object. |
| TdaBDEDataSet | Passes the method calls of the TdaDataSet class through to standard Delphi TTable and TQuery components. |
| TdaBDEQueryDataView | This class stores the results of work completed in the Query Wizard and Query Designer via the SQL object it contains. The SQL generated by the SQL object is assigned to a standard Delphi TQuery in this class. |
| TdaBDETemplateDataView | This class can be used when custom dataview templates are needed. Dataview templates utilize a developer-supplied user-interface for the creation and modification of the dataview. This is generally done to replace the Query Wizard and Query Designer with a totally customized user-interface. |
| TdaBDEQueryTemplateDataView | This class can be used when custom dataview templates are needed. Dataview templates utilize a developer-supplied user-interface for the creation and modification of the dataview. This is generally done to replace the Query Wizard and Query Designer with a totally customized user-interface. |
DADE is a flexible and extensible architecture that enables developers to tailor the functionality delivered to meet the requirements of a particular application. The most common ways in which DADE is extended are as follows:
1. Dataview Templates
Create dataview templates to customize the dataview creation process or to provide datapipeline configurations that cannot be created via the built-in query-based dataview.
2. Support for Non-BDE Database
Create native support for a non-BDE database so that the Query Wizard and Query Designer can be used without the BDE.
3. Ask at Run-Time Support
replace the built-in query-based dataview class with one that provides ‘ask at run-time’ capabilities.
4. New Data Wizard
Create a new data wizard.
DataView Templates
A dataview template is a special type of dataview class that has been declared by you, the developer. And while the visual representation of the dataview in the data workspace remains the same as any dataview, the user-interface used to create and modify the dataview is totally dependant on what you want to provide to end-users. Dataview templates can be used for anything from creating predefined relations between a set of tables to integrating a full-blown query builder. In this section, we will show how you can create a dataview template. But before we do, let’s take a look at what the end-user will see when he uses a dataview template.
A DataView Template: the End-User View
When dataview templates are registered with DADE, an additional tab is added to the New dialog. The figure below illustrates what we would see by accessing the File | New menu option within the data workspace:
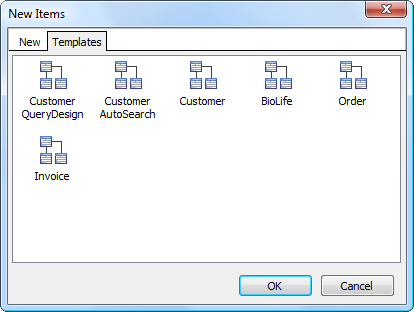
Here we can see that six different dataview templates have been registered. After double-clicking on the ‘Order’ template, we see the following screen:
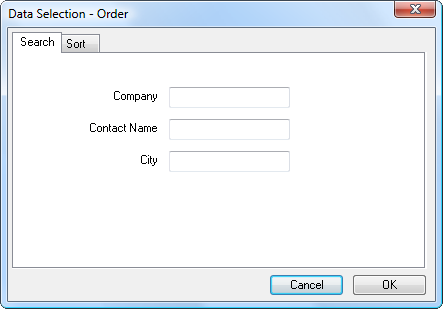
This is a custom dialog created by the developer of the Order dataview template. It allows the end-user to enter simple search and sort criteria. Once we’ve done this and click OK, the completed dataview will be displayed:
As you can see in the data pipeline list of this dataview, this template has declared relationships between the customer, order, and order items tables. Each table is independent and has its own data pipeline. By clicking on the Design tab and accessing the Report | Data menu option, we can see how this dataview has assigned the data pipelines to the report:
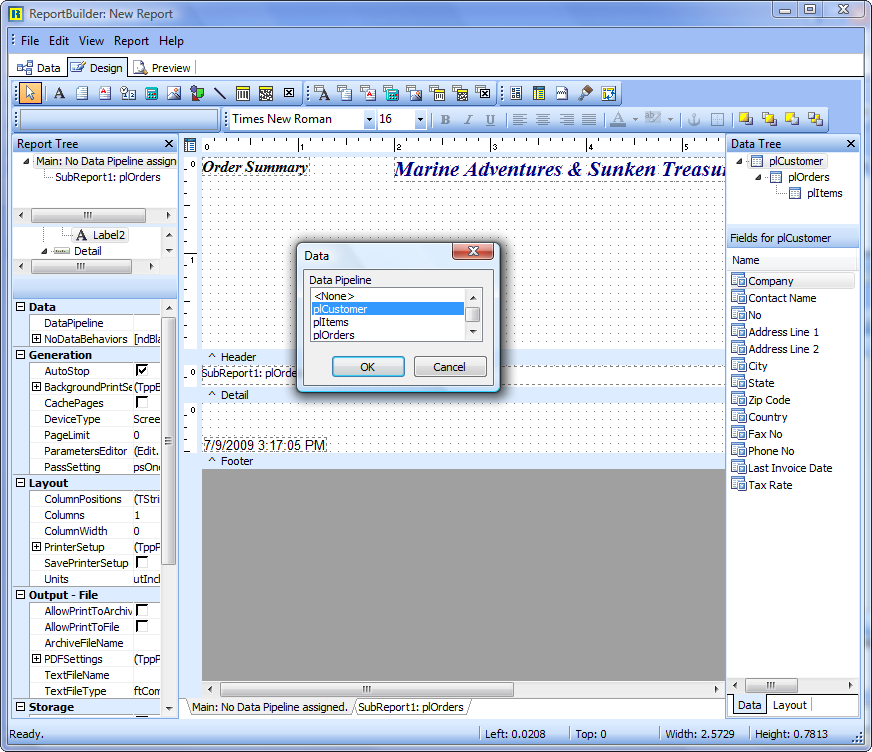
The customer data pipeline is assigned as the master and the orders data pipeline is assigned to the detail band. The items data pipeline is available, and we could create a subreport and assign it to this datapipeline. This sort of data pipeline configuration is not available from query-based type dataviews, so this is probably one of the reasons why the developer chose to create this dataview template.
A DataView Template: the Implementation
This dataview template is implemented as an SQL query on the customer table with nested detail tables on the order and items tables. Some of the fields from the order detail table are actually supplied from the employee table, which is configured as a lookup table:
A completed and working version of the order dataview template is available in the Demos\EndUser\2. Custom DataView Templates\ directory within the main ReportBuilder directory.
Support for Non-BDE Database
DADE is built upon the concept of the dataview. A dataview is responsible for creating the data access objects required to connect a report to data. A dataview must contain at least one datapipeline. A typical dataview will contain one or more datapipelines, datasources, and datasets. Dataviews are created and maintained visually in the data workspace of the report designer. By implementing new descendants of several classes within DADE, we can integrate a non-BDE database into DADE so that the visual tools provided in the data workspace (i.e. the Query Wizard, Query Designer and custom dataview user-interfaces) can be used with that database.
In the course of normal operation, the Query Wizard and Query Designer require certain information from the database, such as a list of tables from which data can selected, or a list of fields for a given table. These visual tools never directly reference any database objects in obtaining this information, but instead rely on functionality provided by the dataview. This architecture enables these tools to be used without the BDE.
As an example, we have created a dataview descendant that can be used with ODBC98.
ODBC98 is set of native Delphi data access components that provide direct access to ODBC databases without the BDE. The components for the most part mimic the BDE- based components found in Delphi (Session, Database, Table, Query, StoredProc, etc.). ReportBuilder is designed to access TDataSet descendants via the DBPipeline component. Therefore, it can work with ODBC98 seamlessly right out the box. ReportBuilder Pro, however, contains the Query Wizard and Query Designer, which are designed to work with a special dataview class: TdaQueryDataView. Therefore, we must create a descendant of this class in order to integrate ODBC98 with ReportBuilder Pro.
Implementing a QueryDataView descendant requires us to define the following set of classes:
| Class Name | Description |
|---|---|
| TdaChildODBC98Query | ▪ Descendant of TODBC98Query that can be a child of a DataView ▪ Override the HasParent method of TComponent to return True ▪ Must be registered with the Delphi IDE via RegisterNoIcon |
| TdaChildODBC98Table | ▪ Descendant of TODBC98Table that can be a child of a DataView ▪ Override the HasParent method of TComponent to return True ▪ Must be registered with the Delphi IDE via RegisterNoIcon |
| TdaODBC98Session | ▪ Descendant of TppSession ▪ Implements GetDatabaseNames, GetTableNames, etc. |
| TdaODBC98DataSet | ▪ Descendant of TppDataSet ▪ Implements GetFieldNames for SQL |
| TdaODBC98QueryDataView | ▪ Descendant of TppQueryDataView ▪ Uses the above classes to create the required Query -> DataSource -> Pipeline -> Report connection ▪ Uses the TdaSQL object built by the QueryWizard to assign SQL to the TODBCQuery etc. |
If you have ODBC98, you can see these classes in action by installing the ODBC98 demo provided in the ReportBuilder Pro EndUser\Demos directory. Complete directions for installing these classes is provided in this directory.
Ask At Run-Time support refers to the common task of allowing the end-user to specify parameter values that can be used to limit the scope of a report. As an example, for an invoice report, the end-user might specify a company name and date range.
ReportBuilder’s AutoSearch feature offers a RAD solution to the drudgery of adding ask-at-runtime support to your reports. ReportBuilder’s Query Designers can be used to designate search criteria as AutoSearch. Thereafter, any time the report is executed, ReportBuilder will display an ask-at-runtime dialog and use the parameter values entered by the end-user to dynamically generate the SQL Where clause for the report.
The following screen shot shows an example of an ask at run-time dialog generated and displayed by ReportBuilder.

The default AutoSearch dialog can be replaced by a customized version that you create and register with ReportBuilder. A demo of this technique is provided in the Demos\EndUser\5. AutoSearch \4. Custom AutoSearch Dialog\ directory.
End-User Reporting
The Designer is a non-visual component that acts as a ‘wrapper’ around the report designer window displayed in the end-user reporting solution. By setting the various properties and events of the designer component, you customize the content and behavior of the report designer. The most commonly used properties of the designer component are listed below:
| Property | Description |
|---|---|
| AllowDataSettingsChange | Used to control whether the DataSettings menu option appears in the File menu of the data workspace. Usually disabled to prevent end users from changing the database settings. |
| AllowSaveToFile | When set to True, the File menu of the design workspace has ‘Load from File’ and ‘Save to File’ menu options. |
| DataSettings | DADE only. Used to configure DADE (data workspace) for a given database. |
| Icon | The icon to be displayed on the report designer window. |
| RAPInterface | RAP Only. RAP configuration settings. |
| RAPOptions | RAP Only. Further RAP configuration settings. |
| Report | The report object that will be used to load and save reports. The configuration of the Report.Template properties are used by the report designer to determine how reports will be loaded and saved. |
| ShowComponents | Determines which components will be displayed in the ReportBuilder component palettes. Sometimes used to disable advanced components such as regions or subreports. |
| TabsVisible | Determines whether the Design and Preview tabs will display. When set to false, the report designer becomes a ‘design only’ window, where the end-user can work on the layout, but cannot preview. If DADE or RAP is installed, then this property cannot be set to False. |
A Simple End-User Report Solution
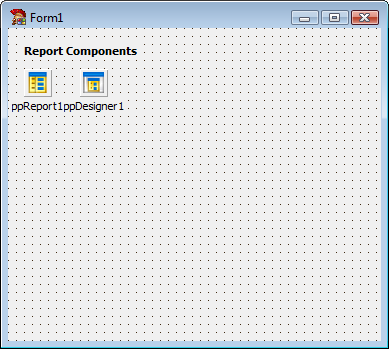
1. Create Report and Designer components
Place a designer component and a report component on a form, and connect the report to the designer by assigning the Designer.Report property.
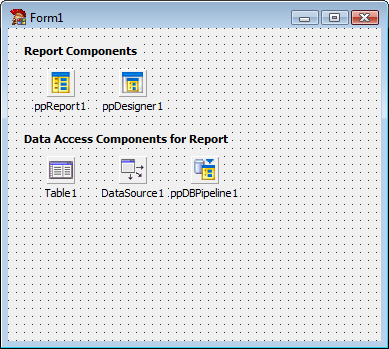
2. Create data access components
Create data access components to supply data to the report. Here we have created TTable, TDataSource, and TDBPipeline components.
3. Create a button to launch the report designer.
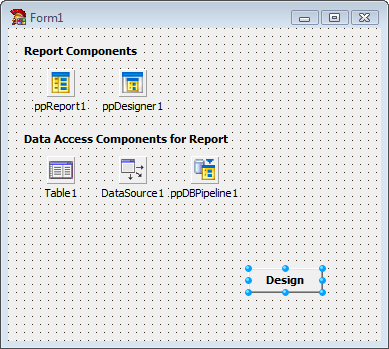
4. Code the OnClick event of the button to launch the designer.
5. Run the application and click the ‘Design’ button to launch the designer.
The user can now design a report based on the customer table. The report layout can be saved to a file, or pre-existing layouts can be loaded from file. Reports can only be created based on the customer table, since that is the only table available to the report.
While this end-user solution is simple and easy, it does have some limitations:
| 1. |
This approach does not provide a data workspace where different data besides the customer table can be accessed. |
| 2. |
The ability to save or open reports layouts to file is dialog-based, and therefore the user does not have a way to organize and keep track of the many reports they may create. |
These limitations can be addressed with additional functionality available in ReportBuilder Professional (namely DADE and the Report Explorer). These solutions are discussed at length throughout this section of this website.
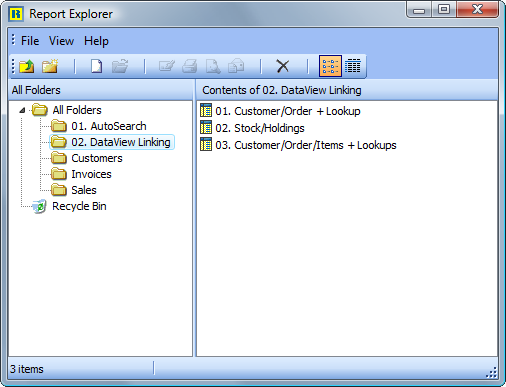
The Report Explorer component allows you to deploy a Windows Explorer interface that your end-users can use to organize their reports. The Report Explorer handles all operations via datapipelines; therefore, the folder structure and all of items within it can be saved to database tables. This interface presents a minimal learning curve as most users are familiar with the operation of the Explorer. The Report Explorer user-interface is pictured below:
| Button | Description | |
|---|---|---|
| Up One Level | When a folder is selected, use this button to select the parent folder. | |
| New Folder | Creates a new folder within the currently selected folder. | |
| New Report | Creates a new report and displays the report designer. | |
| Open Report | Opens the currently selected report and displays it in the report designer. | |
| Prints the currently selected report. | ||
| Print Preview | Opens the currently selected report and displays it in the print preview window. | |
| Delete | Sends the currently selected items or items to the recycle bin. If the items are already in the recycle bin, it deletes them. | |
| List | Sets the list to display in columns and shows the item name only. | |
| Details | Shows one item per row, lists metadata about items: item type, item size, date last modified. |
The action that each button on the Report Explorer toolbar performs is described below:
The data dictionary is a non-visual component designed to provide the data workspace with the capability to replace the table names and field names retrieved from the database with more readable aliases that you provide. The most commonly used properties of the data dictionary are described below:
| Property | Description |
|---|---|
| FieldFieldNames | The names of the fields to be used in accessing the field aliases. |
| FieldPipeline | The name of the data pipeline that has access to the field aliases. |
| TableFieldNames | The names of the fields to be used in accessing the table aliases. |
| TablePipeline | The name of the data pipeline that has access to the table aliases. |
The data model for the database tables underlying the data dictionary is shown below:
The TableName is the key field of the table. The TableName and FieldName are the key fields of the field table. The Selectable field determines whether the field can be selected within the Query Wizard and Query Designer. The Searchable field determines whether the field can be used in search criteria. The Sortable field determines whether the field can be used to order the data.
Once the data dictionary tables have been created and populated, they can be assigned to a standard Delphi TTable or TQuery component, which can then be assigned to a data pipeline via a TDataSource. The pipelines are then assigned to the TablePipeline and FieldPipeline properties of the data dictionary. The diagram below shows a fully configured data dictionary component. The data dictionary component is assigned to the data workspace via the DataDictionary property of the designer component.
The Data Dictionary Builder is an editor for the DataDictionary component. It is designed to generate and maintain the DataDictionary information used by the Data workspace. To access the DataDictionary Builder, configure theDataDictionary.BuilderSettings to connect to your database and then double-click on the DataDictionary component.
The following options are provided:
| Option | Description |
|---|---|
| Generate | Automatically create entries corresponding to the tables and fields in the database. |
| Synchronize | Automatically delete entries for tables and fields that have been removed from the database. |
| Add | Add individual entries |
| Edit | Edit individual entries |
| Delete | Delete individual entries |
In order to create the most sophisticated and complete end-user reporting solution possible using ReportBuilder, we need to connect and configure all of the components available in ReportBuilder Professional.
The screenshot below shows the configuration of a full-featured end-user reporting solution (the colored shapes and labels have been added for informational purposes only).
A completed version of this solution is available in the ..RBuilder\Demos\EndUser\1. Report Explorer directory. Step-by-step instructions for creating this application are provided in the‘Building an End-User Reporting Application’tutorial of the Developer’s Guide.

ReportBuilder Professional and Enterprise Editions include the ability to build end-user reporting solutions that are royalty-free. The End-user reporting solution must be a part of a larger application and access a single database. For example, you cannot build a general purpose query or reporting tool and distribute that royalty-free. The license prohibits this type of solution.
ReportBuilder Server Edition currently includes a single developer license for ReportBuilder Enterprise and a single developer license to ReportBuilder Server. Also included is a Server Deployment License for a single CPU. This enables you to install a report server solution to a single CPU machine. Additional Server Deployment licenses are US $299.00 per CPU. Thus to deploy a server solution to a dual processor machine requires two deployment licenses. A report server can support as many clients as the hardware will allow. In summary, the licensing is per server CPU, not per client seat.
Report Design
ReportBuilder allows you to create highly dynamic report layouts. The SubReport,Memo, RichText, and Region components have the ability to expand or contract to accommodate the information they contain. There are a host of properties designed to keep your reports looking good in the variety of situations created by these dynamic components.
| Property | Description |
|---|---|
| StretchWithParent | Allows a shape or line to expand or contract based on the change in height of the band or region in which it is contained. |
| ShiftWithParent | Allows any non-stretching component to move up or down based on the change in height of the band or region in which it is contained. |
| ShiftRelativeTo | Used to specify the vertical positioning which should take place between multiple stretching components in a band. |
| StopPosition (for subreports) | Used to set the position on the page where a child type subreport will stop printing. Allows a child type subreport to be confined to a rectangular area of the page. |
| BottomOffset | Used to create white space between multiple stretching objects which have been linked together using the ShiftRelativeto property. |
| OverFlowOffset | Controls where a stretching component will begin printing when it overflows onto additional pages. This property can be used to print an object at a different starting position when it overflows onto additional pages. |
| ReprintOnOverFlow | Used to print non-stretching components again when stretching components are printing on additional pages. |
One Memo with a Shape Background
Here we have a single memo in the detail band with a shape behind it. The shape has the StretchWithParent property set to True. The ‘parent,’ in this case, is the detail band. When the band generates, the memo will stretch based on the text it contains; the band will resize to accommodate the memo, and the shape will resize based on the change in height of the band. This action creates the effect of a border and background for the memo. If the memo overflows onto additional pages, we can instruct the shape to print also by setting the shape’sReprintOnOverFlow property to True.
One Memo with Label Beneath
Here we have a single memo in the detail band with a label below it. The labelhas the ShiftWithParent property set to True. The ‘parent,’ in this case, is the detail band. When the band generates, the memo will stretch and band will increase or decrease in height accordingly. The label will shift based on the change in height of the band.
One Memo in the Detail Band
Here we have a single memo component in the detail band. The memo’s Stretchproperty has been set to True. Each time the detail band prints, the height of the memo is recalculated based on the amount of text it contains. As a result, the memo may either grow or shrink in size and the detail band will grow and shrink with it. The memo may contain so much text that it cannot fit on a single page. In this case, the memo will print on additional pages until it is complete. In ReportBuilder, this condition is referred to as overflow. Both the memo and band components have a boolean OverFlow property which can be checked while the report is generating to determine if the memo is printing on an additional page.
Two Side-by-Side Memos with Labels below
Here we have two memos in the detail band, each set to stretch. When the report generates, the band will grow or shrink to accommodate the memo that contains the most text. Each memo has an associated label below it. We want the labels to shift in relation to the memo above. In order to accomplish this, we place the labels in a region and then set the region’s ShiftRelativeTo property to point at the memo above. Now when the report is generated, each label shifts in relation to the associated memo.
One Memo with Two Side-by-Side Memos below
In this report we have single stretching memo that needs to print to completion, then two additional memos need to print, starting immediately after the first. By placing the second two memos in a region and setting the region’sShiftRelativeTo property to point at the first memo, we can achieve this effect.
Two Stacked Memos in the Detail Band
This report requires two memos to be printed, one after the other. This requirement is met by setting the ShiftRelativeTo property of the second memo so that it points at the first. With this configuration, the first memo will print, stretching to accommodate the text it contains, and then the second memo will print to completion.
Child-Type SubReports in Fixed Positions
This report emulates a form that contains information in fixed rectangular areas of the page. By placing child-type subreports at the beginning of each rectangular area and setting the StopPosition property equal to the bottom of the rectangular area, we can get the report to ‘fill-out’ this form for us.
In traditional banded-style report writers, reports that can be printed from a single source of data are quite easy to create. But if the content of the report consists of information from several different sources of data, the choices become quite limited. One option is to use SQL to join the data together into one’virtual table’, and then build the report based on this table. If many tables are involved, the performance of this approach can be prohibitive.Delphi provides an alternative to this approach by allowing linkages to be established between data access objects. Within ReportBuilder we can use free-form subreports to take advantage of the many configurations these data access objects make possible.

Single Data Source
A single data source can be connected directly to the report via the DataPipeline property. When printed, the report will generate one detail band for each record provided by the data source.
Independent Data Sources
Here we have three sources of data with no linkages between them. In this report we want to print all of the customers, then all of the products, and then all of the vendors. The report needs to fit together like a book, with each data source providing a ‘chapter’. Here we use the main report to launch a subreports for each of the data sources. The subreports would be set with a PrintBehavior of section, which means that each subreport would start a new page, generate a set of pages as necessary to traverse all of the data of the data source and then return control to the main report. The main report is not connected to any data source, so we would manually stop the report generation process by coding an event handler in the detail band AfterPrint event. This event handler would call theReport.DataTraversalCompleted procedure, which would stop the report generation process after all of the subreports have completed printing.
Master Data Source with Single Detail Data Source
In this scenario, the master data is connected to the detail data via a field or set of fields. It is assumed that this connection results in multiple detail records being selected for each individual master record. The master data source is assigned to the report, and the detail data source is assigned to the detail band of the report. The report steps through each of the master records and generates one detail band for each record in the detail data source. If there are no corresponding detail records for a given master record, the report generates a blank detail band.
Master Data Source with Nested Detail Data Sources
Here we have the master data source containing a list of customers. Each customer has multiple orders; each order has multiple products, and each product has multiple potential vendors. This configuration is called ‘nested’ because each set of records is selected based on the linkage established with the previous data source.
The first two data sources can be handled as in the standard Master/Detailarrangement. The customer data source is assigned to the report, and the order data source is assigned to the detail band. The next two data sources can be handled by a subreport. A subreport has all of the capabilities of a regular report – the only difference is that it can be placed within the band of another report. In this case, we place the subreport in the detail band of the main report. It will then print once for each order record. Within the subreport, we assign the report to the part data source and the detail band to the vendor data source.
By configuring the report in this manner, the following information will be printed: all customers, all orders for each customer, all parts for each order, and all vendors for each part.
Master Data Source with Multiple Independent Data Sources
Here we have the order table. Each order has many order items. For each order there is also a group of vendors that can supply the products for that order. Both of these data sources are linked to the master data source, as opposed to being nested within one another; therefore, the data sources are ‘independent’. This type of data can be handled by placing two subreports in the detail band. The first subreport can be linked to the order item data source, and the second subreport can be linked to the vendor data source. In order to print the vendor data after the order item data, we would link the vendor subreport to the order item subreport via the ShiftRelativeTo property.
Form Emulation is the process of taking a paper-based or electronic form and rendering a likeness of it. The likeness may include formatting of the form itself, or may only contain the data which will ‘fill-out’ the form. There are two basic issues that a form emulation solution must resolve:
1. How will the formatting of the form be generated?
2. How will the data which ‘fills-out’ the form be generated?
The first issue is resolved by using either a page-sized band within the report or by utilizing a page style. A page style can be designed just like a band, but generate as a background to the bands of the report.
The second issue is resolved by using either simple data-aware components or by using more complex region or subreport components.
In ReportBuilder, there are several approaches that achieve form emulation. These approaches are discussed in detail in this section.
Single Page Forms
1. Expand the detail band to the printable height of the page, hide the header and footer band, and place all form formatting and data-aware controls in the detail band. This approach yields one form per record. The following diagram shows an entire form in the detail band.
2. Add a page style to the report. Place all formatting for the form in the page style. Layout the data-aware controls as you would when building a normal report. This approach yields a variable number of records per form, depending on the height of the bands. In this approach, the detail band is used to ‘fill-out’ the form. The following diagram shows how a detail band can ‘fill-out’ a page style.
3. Expand the detail band to the printable height of the page. Hide the header and footer band, and place all form formatting in the detail band. Place child-type subreports in different areas of the form where a table or particular source of data is needed to fill out that part of the form. Place data-aware components in areas of the form where the master datapipeline supplies the data. This action yields the most flexible and powerful form emulation solution, but is only needed when multiple data sources are used. The following diagram shows subreports filling out a form in the detail band.
The form itself may be too complex to recreate using report components. In this case it is recommended that you scan the form and convert it to a windows metafile. You can then place the windows metafile in the report as either a ‘background’ for the detail band or in the page style, where it will function naturally as a background for the report.
When you have a form in a WMF image, the end-user gets an excellent print preview capability. If you are printing on pre-printed forms, you can set the visible property to false when the report is sent to the printer. In this way you can provide a filled-out form in the print preview window, but only the text necessary to ‘fill-out’ the form is actually sent to the printer.
Multi-Page Forms
All of the approaches discussed in the single page form topic are applicable to the multi-page forms. The additional problem of organizing single-page forms into sets of multi-page forms can be resolved using section style subreports. When Section-style subreports are rendered, they generate a new page within the parent report, continue generating pages until all data has been traversed (or they are stopped manually through a procedure call to the report engine), and then return control to the parent report. One special behavior of section-type subreports is that the parent report generates no pages when the section is placed in a dynamic-height detail band. In this case, the main report is used as a launching pad for one to many sections. Since each section is a full-fledged report in its own right, all of the single page form approaches can apply to each section, thus creating a multi-page form solution.
The diagram below shows three section-type subreports in the detail band of the main report. The main report is assigned to a data pipeline, so the detail band will print once for each record. The subreports contain data-aware controls that point at this data pipeline. After the detail band of the subreports prints, the DataTraversalComplete method of the report is called, manually stopping the report. This report provides three pages of content for each record, and each page has its own unique format.
The various toolbars accessible from the design workspace are documented in this section. The toolbars are dockable and follow the Office97 interface style. The Toolbars are accessible from the View | Toolbars menu option of the Report Designer or by right-clicking on the docking area at the top of the Report Designer.
The Report Tree
To access this tool window, select the View | Toolbars | Report Tree menu option from the Report Designer main menu. This tool window is dockable only on the left and right sides of the Report Designer. It can be used to organize components within each band. Components selected in the Report Tree are selected in the report layout. The upper portion of the Report Tree shows the main report object and any subreports nested within it. This feature can be helpful for organizing your subreports.

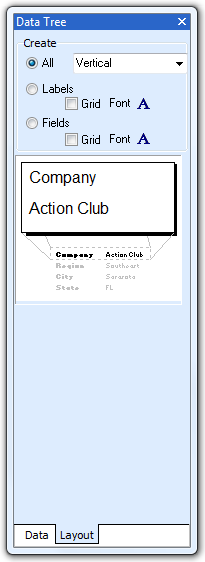
The Data Tree
To access this tool window, select the View | Toolbars | Data Tree menu option from the Report Designer main menu. This tool window is dockable only on the left and right sides of the Report Designer. It can be used to create components within any band. Simply select a set of fields and drag the selection into the band. A set of corresponding data-aware components will be created.
ReportBuilder contains a Report Wizard that allows you to quickly create an entire report layout. This is great for generating an entire report, but what if you need to create only a portion of a complex report? Drag and drop functionality is an ideal solution for this problem because it allows you to create a set of components within the context of an existing report layout.
In ReportBuilder, drag and drop support is provided via the Data Tree (pictured below).
Data Tree - Data tab
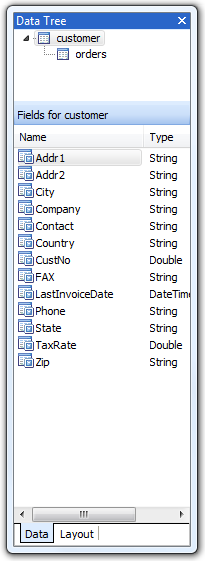
The Data Tree has two tabs. In the top tree view, the ‘Data’ tab contains a list of data pipelines to which the report has access. In the bottom list view, all of the fields for the currently selected data pipeline are displayed. Fields can be selected from the bottom list view and dragged to any part of the report layout. The data-aware component that is appropriate for the given field will then be created along with a label and border.
Data Tree - Layout tab
The second tab of the Data Tree is entitled ‘Layout’. This tab allows you to control the behavior of drag-and-drop. By default, a label and border are created for each data-aware component. You can turn the label off, the border off, control the color of the label or border, and control the font of the label and data-aware component from this tab. Once you’ve set the drag-and-drop behavior, it will be retained for future design sessions.
Report Wizard: Create a Simple Report
The following screen shots step through the creation of a simple report via theReport Wizard.
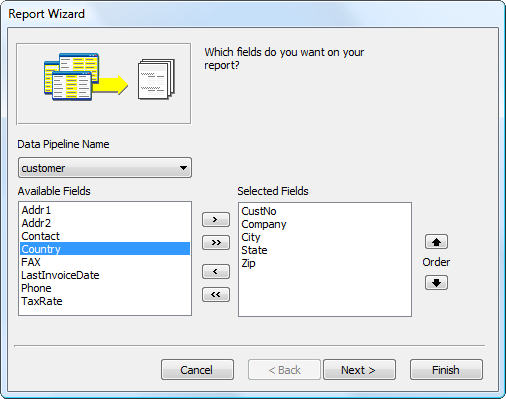
1. Select the fields.
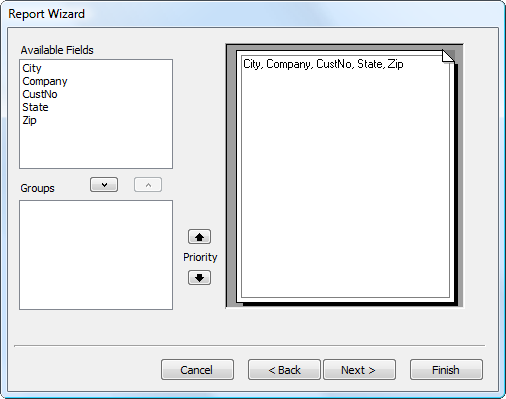
2. Skip the groups page.
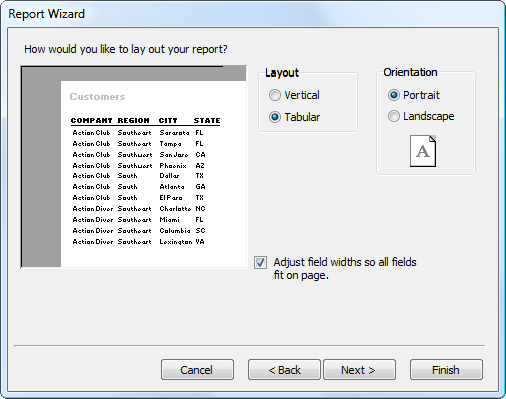
3. Select the layout.
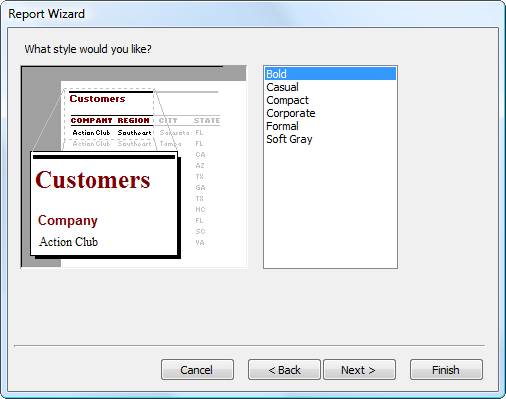
4. Select the style.
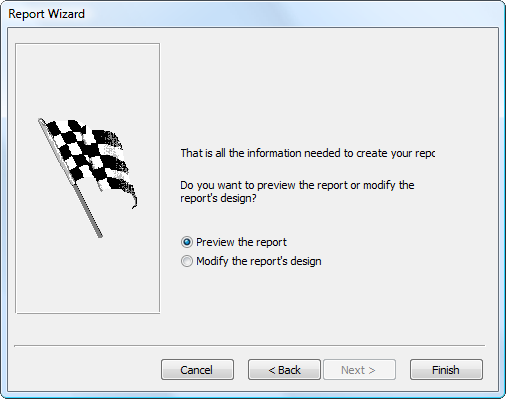
5. Select Design or Preview and Finish.
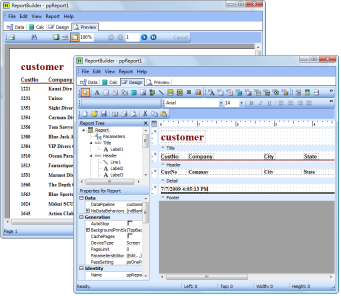
6. Report as it appears in the Preview & Design workspace.
The Report Wizard is one of the many parts of ReportBuilder that reflects a level of professionalism and attention to detail found in no other reporting product. If you or your end-users have utilized standard Windows wizards in other products, then you will be able to quickly recognize and use the ReportBuilder Report Wizard.The Report Wizard can be accessed via the File | New menu option of the report designer. A series of screens are presented, each requesting information about the report. When the last page is reached, either a preview or design option can be selected. When the ‘Finish’ button is clicked, it ca uses a report to be created and displayed as requested.
Data Access
In ReportBuilder, data access is provided via the DataPipeline component.
ReportBuilder includes data pipelines for accessing data from a variety of sources:
| Pipeline | Description |
|---|---|
| DBPipeline | Used for accessing data via the BDE, third-party BDE replacement products, or TDataSet descendants. The DBPipeline is connected via the DataSource property. |
| TextPipeline | Used to access data in ASCII text files. |
| JITPipeline | Just-In-Time pipeline for accessing data in Delphi objects. |
Regardless of the type of pipeline or the type of data being accessed, the data pipeline component has two basic purposes:
1. Supply data
2. Control data traversal
Supplying Data
Data pipelines provide data via field objects. For instance, the following code would retrieve the current field value of a field called ‘Company’:
lValue := DataPipeline1.Fields[‘Company’].Value;
Each time a data-aware report component prints, it uses this approach to retrieve the data from the data pipeline. Data-aware report components have two properties that determine the data they will retrieve: DataPipeline and DataField. The name of the appropriate data pipeline component is assigned to the DataPipeline. The DataFieldproperty is assigned the name of the field that contains the data to be displayed. Once these two properties are assigned, the data-aware component has the ability to retrieve data directly from the data pipeline, independent of the report where the data-aware component resides.
Controlling Data Traversal
The second purpose of the data pipeline is to control data traversal. Data traversal is the act of moving from the first record of the data to the last record. When a report is printed, the report engine traverses the data by doing the following steps:
1. Opens the data pipeline.
2. Goes to the first record.
3. Begins printing the page and then gives the detail band the opportunity to print.
4. Goes to the next record.
5. Gives the detail band the opportunity to print.
6. Continues steps 4 and 5 until there is no more page space.
7. Completes the page.
8. Continues steps 4 through 7 until all records have been exhausted.
It is important to note that when the detail band is given the opportunity to print, the data-aware components within the detail band are rendered – at which point they retrieve the field value of the current record. The engine then moves to the next record and prints the detail band again. It is this combination of the report traversing the data and the data-aware components retrieving the data that creates the pages of the report. If the data pipeline is not assigned to either of these entities (data-aware component or report), then the report will not work. Therefore, the report must be assigned to a data pipeline and each data-aware component must be assigned to a datapipeline and a datafield.
We’ve said that the report engine traverses the data. That isn’t completely true. The report engine makes requests of the data pipeline (such as open, first, next, last), and then relies on the data pipeline to do the work. This means that the data pipeline controls the data traversal. This control can be used to great advantage.
For instance, let’s say you are displaying a database grid on a form. The user has selected an individual record of the grid and wants to print that record. If you have a datapipeline pointed at the same dataset as the grid, then it can access all of the records. However, we can instruct the data pipeline to traverse only the current record by simply setting the RangeBegin and RangeEnd properties to CurrentRecord. When the report prints, it will send traversal requests to the data pipeline, and the data pipeline will traverse only one record. It will then inform the report engine that all records have been traversed and the report will print only one record.
Let’s take this example further and say that you let the user select multiple records from the database grid. You then want the report to contain only the selected records. In this case we can assign the Bookmarks from the grid to the BookmarkList property of the data pipeline. When the report prints, the data pipeline will traverse only those records in the list of bookmarks and only those records will appear in the report. Essentially, the engine makes the same traversal requests of the data pipeline for every report, but the data pipeline controls how the data is actually traversed.
ReportBuilder augments this data access model by adding another component: the data pipeline. There are several different types of data pipelines, but for purposes of accessing database data, a DBPipeline component can be used. The following screen shows a DBPipeline retrieving the same field value.

BDE stands for Borland Database Engine. The Delphi development environment utilizes the BDE to access data in desktop database files (such as Paradox or Access) and in client-server databases (such as Oracle and Sybase).One of the reasons Delphi has been so successful is the wide range
of datasets that can be accessed via the BDE. ReportBuilder leverages this powerful solution with standard support for the BDE. In Delphi, data access via the BDE can be accomplished using a TTable or TQuery component. A TDataSource component is then connected to the table or query. A data-aware component can then be connected to the datasource. The following screen-shot shows a field value being retrieved into a data-aware memo component.

The value is displayed in a ReportBuilder data-aware memo component. You may notice that only the first line of the memo is shown in the ReportBuilder Report Designer. This is due to the fact that when the report generates, the memo component will recalculate the height based on the text it contains. Therefore, there is no reason to specify the height of the memo in the report layout, as it will automatically resize on the printed page.
| Product | Description |
|---|---|
| Advantage by Extended Systems | Provides access to .DBF files. Desktop and high performance Client/Server versions available. Includes SQL query support. ReportBuilder allows the Advantage TDataSet descendant to plug in directly. The high-performance, low maintenance features of the Advantage Database Server and the extremely well-designed architecture of ReportBuilder make this combination an excellent client/server reporting solution. |
| DBISAM by Elevate Software | Compact database written in Object Pascal. Includes SQL support. |
| Direct Oracle Access (DOA) by Allround Automations | Provides native access to Oracle. High performance, support for Oracle-specific features. |
| Interbase Objects (IBO) by Jason Wharton | Provides native access to Interbase (no BDE or ODBC required). Also referred to as IB Objects. |
| Opus by Opus Software GmbH | Provides access to MS Access database files. |
| Regatta by Regatta Systems, Inc. | Several products are offered that provide access to BTrieve, MS Access, and SQLAnywhere. |
| InfoPower by Woll2Woll Software | Data access components used to filter, search, etc. Although InfoPower is not a database engine like the products above, the components are widely used by Delphi developers everywhere. |
Reports can be printed directly from text files without using a database product. This functionality is provided via the TextPipeline component. The following formats are supported:
- Comma-delimited
- Tab-delimited
- Fixed-Length records
- Custom delimited (where you specify the delimiter)
The TextPipeline component is essentially a simple data retrieval engine that enables you to access data in text files in the same manner as data stored in a database table. You can even define master/detail relationships between data in two text files. The TextPipeline contains a Field Editor that is used to define the data fields for the text file. Once the data fields have been defined, you can access the Report Designer and assign those fields to ReportBuilder’s data aware components.Each of the data pipelines in ReportBuilder has a Field Editor that is accessible by double-clicking on the pipeline component at design-time. The TextPipeline’s Field Editor is pictured below. Notice that the View Data button has been activated to display the contents of the text file. This feature is useful when defining the fields for the text file.

Data pipelines present a structured set of data to a report. This structure takes the form of records and fields. The report engine expects operations like open, first, next, and last to provide a certain response from the data pipeline. The data-aware components within the report expect field values to be retrievable by simply passing a field name to the data pipeline. In the DBPipeline component, this functionality is implemented by calling the methods of a TDataSet object. However, this is not the only way a data pipeline can provide the necessary data access functionality to a report. The JITPipeline (JIT stands for Just In Time) triggers events to accomplish the same results as the DBPipeline. That is, the JITPipeline provides a set of events that, when coded properly, allow reports to print from any source of data referenced by the event handlers. The following diagram shows a JITPipeline that is assigned to event handlers referencing a standard Delphi string grid. In the report, data-aware components are created just as they would be for any other database report, by assigning field names from the JITPipeline to the data-aware controls in the report. This results in a clean, maintainable implementation. If you later decide to provide data to the report via a text file or database table, you can simply swap out the JITPipeline with a new pipeline of the correct type.
For more specifics on the JITPipeline, see the Developer’s Guide or the Online Help.

If you have a considerable amount of data in a proprietary format and many reports need to be created based on this data, the highest level of maintainability and ease of use will be provided by a custom data pipeline component. This type of component can be created by descending from the TppCustomDataPipeline class and implementing the necessary methods. The end-result of such an effort will be a new data pipeline component that can be installed into the Delphi IDE and used on the same basis as the other data pipelines that are provided with ReportBuilder.
An object model of the ReportBuilder DataPipeline classes is shown below.

Report Output
The primary means by which report output is generated is via a call to the Print method of the report object.
1. Print to Screen
The following code would cause the Print Preview form to be displayed and the first page of the report to be presented in this form:uses ppTypes;ppReport1.DeviceType := dtScreen;
ppReport1.Print;
2. Print to Printer
This code would cause the Print dialog to be displayed. The report would then be sent to the printer:
uses ppTypes;
ppReport1.DeviceType := dtPrinter;
ppReport1.Print;
As you can see, it is quite easy to generate report output using ReportBuilder. In order to use some of the more advanced features related to report output, you will need to understand a little bit more about what is happening behind the scenes to make all of this simplicity possible.
As you may already know, report output is one of the elements of the reporting equation. The reporting equation was described in the introduction toReportBuilder and is as follows:

The native report output in ReportBuilder takes the form of page objects. Page objects contain draw commands, which describe what the page contains. Page objects are sent to devices, which then convert them to a format appropriate for the device. The following diagram shows page objects sent to the ScreenDevice that are then converted to a bitmap for display in the Print Preview form.
The most high-profile and often-used form of report output is contained in the Print Preview form. The Print Preview form is launched automatically when the Print method of report component is called (and the DeviceType property has been set to ‘Screen’). The Print Preview form is pictured below.

The user can preview any page of the report from this form, zoom the page to different levels, and print the report to the printer.
While the Print Preview form provided with ReportBuilder looks and performs like a truly professional user-interface should, you may want to customize it to emulate the look and feel of the rest of your application. This customizing can be done by creating a special form that descends from the CustomPreviewer class and registering it as the ‘official’ print preview form. This process is fully described in the tutorials of the Developer’s Guide.
ReportBuilder contains a host of properties that allow you to control various aspects of the print job.
| Run-Time Packages | |
|---|---|
| rbRCL99 | Report Components |
| rbDB99 | Data Access Components |
| rbUSER99 | Sample RCL Components (Checkbox) |
| rbTC99 | Standard TeeChart Wrapper |
| rbTDBC99 | Data-Aware TeeChart Wrapper |
These properties are contained in the PrinterSetup property of the Report object and can be configured via the Object Inspector or the File | Page Setup dialog of the report designer.
Because all ReportBuilder reports contain a PrinterSetup object, it is possible to use section-type subreports to achieve some fairly incredible levels of print behavior customization. For example, different pages of a report can print from different bins of the same printer or print to different printers entirely. Some of these features are showcased in the printer setting demos provided with ReportBuilder (check demos 121-124).
The TextFile device in ReportBuilder converts report output into an ASCII text file. The intent of this device is to create structured data that can be imported into another application, such as a spreadsheet. The following text file formats are supported:
- comma-delimited
- tab-delimited
- fixed length records
- custom-delimited
Because report output is essentially free-form and can contain many non-textual components, ReportBuilder provides a way for you to tightly control the format of the text file generated via this device. This control is provided by the Print to File Setup dialog(accessible from the File | Print to File Setupmenu option of the report designer). This dialog is pictured below.

This dialog allows you to set the default file name, select the file format, and specify the textual components that will be saved to the file and the order they will be saved. When utilizing the TextFile device, it is mandatory that these settings are completed. If no components have been selected, then a blank text file will result.
1. Print directly to ASCII text file.
Once a report has been configured for ASCII text file output, the following code will generate the report directly to the file:
uses
ppTypes;
ppReport1.ShowPrintDialog := False;
ppReport1.DeviceType := dtTextFile;
ppReport1.Print;
2. Allow the end-user to print to ASCII text file.
The following code will give the end-user the option of printing to text when the print method is called:
uses
ppTypes;
ppReport1.AllowPrintToFile := True;
ppReport1.DeviceType := dtPrinter;
ppReport1.ShowPrintDialog := True;
ppReport1.Print;
The report component has an OnSaveText event that fires each time a textual component is saved to the text file. This event can be used to customize the output generated to the text file. An example of what can be achieved via this event is provided in demo 106 (..\RBuilder\Demos\Reports\dm0106.pas).
By utilizing the highly extensible device architecture of ReportBuilder, it is possible to create your own device class descendants for converting the native output ofReportBuilder into any file format. Some developers have already done just that, and are offering device classes for some of the most popular file formats. These additional devices integrate seamlessly into ReportBuilder.
| Device | Description |
|---|---|
| llPDFLib by Sybrex Systems | Provides file device support for PDF format. Contact Sybrex Systems for more details. |
| Gnostice eDoc Engine by Gnostice | Provides file device support for over 20 formats including PDF, RTF, XHTML, HTML, Excel, TIFF, SVG, PNG, JPEG, Metafile, and others. Advanced features for PDF format include, compression, encryption, TrueType fonts, font embedding/sub-setting, international characters (European, Chinese, Japanese, ...), vector chart and metafile rendering, rich text rendering,. Full featured trial and executable demos can be downloaded from Gnostice. |
You can control whether end users can Archive or Print to any of the supported file formats using the following properties of the Report object:
- AllowPrintToArchive
- AllowPrintToFile
Setting AllowPrintToArchive to True will enable end users to archive reports. You would then need to provide a user-interface for previewing and printing the archived files using the ArchiveReader component. For an example of how to use theArchiveReader, see demo 151 (..\RBuilder\Demos\Reports\dm0151.pas).
Setting AllowPrintToFile to True will enable end users to print to the any of the available file formats. You can control which file formats are available to end users via the device class registration procedures. For example, the following code would remove the ReportTextFileDevice from the list of available file formats:
uses
ppDevice, ppFilDev;
ppUnRegisterDevice(TppReportTextFileDevice);
End-User Applications
In order to set the AllowPrintToArchive and AllowPrintToFile properties within the context of an end-user application, the OnNew and OnLoad events of theReport.Template object should be used to set the default properties of the report. For example, in the End-User demo application, you would add the following code to the main form:
procedure TmyEndUserSolution.FormCreate(Sender: TObject);
begin
{assign event-handler to template events}
ppReport1.Template.OnNew := ReportTemplateEvent;
ppReport1.Template.OnLoadEnd := ReportTemplateEvent;
{remove the report text file device }
ppUnRegisterDevice(TppReportTextFileDevice);
end;
procedure TmyEndUserSolution.ReportTemplateEvent(Sender: TObject);
begin
{set default report properties}
ppReport1.AllowPrintToArchive := True;
ppReport1.AllowPrintToFile := True;
end;
Deploy
‘Report Template’ refers to the binary image created when a report layout is saved to a file or to a database BLOB field. You can use report templates to free your report definitions from the confines of the executable in which they are being utilized. Therefore, if you need to make modifications to a report, you can do so without recompiling and redeploying your entire application. Simply send the new report layout file or database table containing the report layouts to your users.
If you save report layouts to files or database BLOB fields, you can use them to create a versioning system for reports. This way, the original reports supplied with your application are never modified, but end-users can create versions of these reports. In order to allow end-users to modify the reports via the Report Designer,ReportBuilder Professional is required.
ReportBuilder report templates leverage technology already present in Delphi. The same logic that is used to save the state of objects as configured on a Delphi form (and stored in a dfm file) is used to save the components of a report layout (in an rtm file). In order to view the content of an .rtm file, set theReport.Template.Format to ftASCII and save the report. Then open the resulting rtm file in the Delphi code editor. You will be able to see the structure of this file format.
File-based Templates
You can load and save report layouts to files using the Report Designer. You can also accomplish this programmatically:
1. Using the Report Designer:
Set the Report.Template.SaveTo property to stFile (this is the default value).
A. Saving a Report Layout
Select the File | Save As… menu option from within the Report Designer. The standard Windows file save dialog will be displayed, enabling you to save the report template to a .rtm file.
B. Loading a Report Template
Select the File | Open… menu option from within the Report Designer. The standard Windows file open dialog will be displayed, enabling you to select and open a .rtm file.
2. Programmatically
A. Saving a Report Layout
The following code saves a report in the ‘test.rtm’ file:
ppReport1.Template.FileName := ‘c:\test.rtm’;
ppReport1.Template.SaveToFile;
B. Loading a Report Template
The following code opens a report layout and prints the report:
ppReport1.Template.FileName := ‘c:\test.rtm’;
ppReport1.Template.LoadFromFile; ppReport.Print;
Database Templates
You can save and load data-based report templates by using the Report Designer or programmatically.
Defining the Database Table
Report definitions can be stored to any database table with the following structure:
| Product | Description |
|---|---|
| Advantage by Extended Systems | Provides access to .DBF files. Desktop and high performance Client/Server versions available. Includes SQL query support. ReportBuilder allows the Advantage TDataSet descendant to plug in directly. The high-performance, low maintenance features of the Advantage Database Server and the extremely well-designed architecture of ReportBuilder make this combination an excellent client/server reporting solution. |
| DBISAM by Elevate Software | Compact database written in Object Pascal. Includes SQL support. |
| Direct Oracle Access (DOA) by Allround Automations | Provides native access to Oracle. High performance, support for Oracle-specific features. |
| Interbase Objects (IBO) by Jason Wharton | Provides native access to Interbase (no BDE or ODBC required). Also referred to as IB Objects. |
| Opus by Opus Software GmbH | Provides access to MS Access database files. |
| Regatta by Regatta Systems, Inc. | Several products are offered that provide access to BTrieve, MS Access, and SQLAnywhere. |
| InfoPower by Woll2Woll Software | Data access components used to filter, search, etc. Although InfoPower is not a database engine like the products above, the components are widely used by Delphi developers everywhere. |
Connecting the Report object to the database
Once the database table has been defined, the next step is to connect the report to the database table. This task is accomplished by configuring the following properties of the Report.Template object. You can do this via the Delphi Object Inspector or programmatically.
Report.Template.DatabaseSettings.NameField := ‘Name’;
Report.Template.DatabaseSettings.TemplateField := ‘Template’;
Report.Template.DatabaseSettings.DataPipeline := plReports;
Loading and Saving Reports
1. Using the Report Designer:
Set the Report.Template.SaveTo property to stDatabase.
A. Saving a Report Layout
Select the File | Save As… menu option from within the Report Designer. A special Save dialog will be displayed, showing all reports in the given database table. You can name the report and then save it to the table.
B. Loading a Report Template
Select the File | Save As… menu option from within the Report Designer. Once a report is saved, you can load it by accessing the File | Open dialog.
2. Programmatically
A. Saving a Report Layout
The following code saves a report in the ‘test.rtm’ file:
ppReport1.Template.FileName := ‘Order Summary’;
ppReport1.Template.SaveToDatabase;
B. Loading a Report Template
The following code opens a report layout and prints the report:
ppReport1.Template. DatabaseSettings.Name := ‘Order Summary’;
ppReport1.Template.LoadFromDatabase;
ppReport.Print;
The end-user reporting solution in ReportBuilder Professional is comprised of three primary components that can be configured at Delphi design-time. Each component contains properties pertaining to data access.
1. Report Designer
The Designer’s DataSettings object is used to specify the connectivity parameters for the query wizard and query designer tools. In a typical end-user reporting solution, the end users will be creating and modifying reports that access data residing in a departmental or corporate database.
2. Report Explorer
The Report Explorer’s Folder and Item objects are used to specify connectivity information for the folder and item database tables. These tables are used to store the folders, reports, and dataviews created by the end-user. Depending upon the specific requirements of the application, the folder and item database tables may reside in a local database on each user’s workstation, or they may reside in the database server.
3. Data Dictionary
The DataDictionary’s Table and Field objects are used to specify connectivity information for the table and field database tables that are used to provide user-friendly table and field alias information to end users. The table and field database tables may reside in a local database on each user’s workstation, or they may reside in the database server.

Local End-User Tables
In this scenario, each user has a local copy of the end-user tables that are used as a personal database for storing their reports. For example, suppose the corporate database resides on an Oracle database server and you decide to deploy the end-user tables locally using SQLAnywhere. To implement this strategy, you would configure theTppDesigner.DataSettings to specify the connectivity parameters for the Oracle database server. The Report Explorer tables would reside in the local SQLAnyWhere database, and the Data Dictionary tables could reside in either place, depending upon your preference.
Shared End-User Tables
In this scenario, reports created by end users reside in a multi-user database that is shared. For example, if the corporate database resides on an Oracle database server, the end-user tables would also reside on the Oracle server.
ReportBuilder can be deployed as part of your executable. Simply include the correct path to the compiled units (.dcu files) of ReportBuilder in your Delphi Library Path. For example:
‘c:\program files\borland\bds\3.0\rbuilder\lib’
The ‘lib’ directory contains the compiled units of ReportBuilder. When you compile your application, necessary dcu files from this directory will be linked into the resulting executable file. Executable files created this way are stand-alone in that they can be distributed successfully without any supporting files.
Applications containing ReportBuilder will not compile correctly if the library path is not configured properly. If there are directories in the Library path pointing at old versions of ReportBuilder or at the Source directory of ReportBuilder, problems will result.
Accessing the Delphi Library Path
In order to access your Library Path in Delphi, select Tools | Environment Options from the Delphi main menu. The Environment Options dialog will be displayed. Click the Library tab. The Library Path is the first item. Click the dialog button to the left of the library path edit box. The directories that make up your library path will be displayed.
You can optimize the size of your executable by compiling your project with packages. To compile with packages, access the Project Options dialog, select the‘Packages’ tab, and click on the ‘Build with Packages’ check box. The list of package names that appears to the left of this check box should include the followingReportBuilder run-time packages:
| Run-Time Packages | |
|---|---|
| rbRCL99 | Report Components |
| rbDB99 | Data Access Components |
| rbUSER99 | Sample RCL Components (Checkbox) |
| rbTC99 | Standard TeeChart Wrapper |
| rbTDBC99 | Data-Aware TeeChart Wrapper |
A typical package list for a project containing a ReportBuilder report is as follows:
Vcl90;Vclx90;Vcldb90;vcldbx90;VclSmp90;rbDBDE99;rbRCL99;rbDB99; rbTDBC99;rbUSER99;tee90;teeUI90;teedb90
These packages break down as follows:
| Standard Delphi Packages | ReportBuilder Packages | TeeChart Packages |
|---|---|---|
| VCL90 | rbDBDE99 | TEE90 |
| VCLX90 | rbRCL99 | TEEUI90 |
| VCLDB90 | rbDB99 | TEEDB90 |
| VCLDBX90 | rbTDBC99 | |
| VCLSMP90 | rbUSER99 |
All of these packages should be distributed with your executable file in order for it to run properly. These packages are usually installed into the Windows\System directory of the target computer, since this is where most DLLs reside.
ReportBuilder includes support for 11 built-in languages. The strings for each language reside in separate resource files. These files are located in the..RBuilder\Languages directory, under a subdirectory named for the given language. Three letter codes are used to differentiate the language DLLs that are installed in the Windows\System directory.
| Language | Enumerated Type | Folder/File Extension |
|---|---|---|
| Default | lgDefault | dft |
| English (Simplified) | lgEnglish | eng |
| Custom | lgCustom | cst |
| Danish | lgDanish | dan |
| Dutch | lgDutch | nld |
| French | lgFrench | fra |
| German | lgGerman | deu |
| Italian | lgItalian | ita |
| Portuguese (Brazil) | lgPortugueseBrazil | ptb |
| Portuguese | lgPortuguese | ptg |
| Spanish | lgSpanish | esp |
| Spanish (Mexico) | lgSpanishMexico | esm |
| Swedish | lgSwedish | sve |
| Norwegian | lgNorwegian | nor |
Component Overview
The following components appear on the RBuilder tab of the Delphi component palette when you install ReportBuilder:
| Component | Icon | Description |
|---|---|---|
| DBPipeline | Used for accessing data via the BDE, third-party BDE replacement products, or TDataSet descendants. The DBPipeline is connected via the DataSource property. | |
| BDEPipeline | In previous versions of ReportBuilder, the BDEPipeline was used for accessing data via the BDE. Though it has been replaced by the DBPipeline, it has been retained for backward capability. | |
| TextPipeline | Used to access comma, tab, and fixed-length format text files. Set the FileName property to specify the file. Double-click on the component to define the field structure. | |
| JITPipeline | Used to access any non-structured data stored in Delphi objects or other sources. Provides total control over the data-access process. All event handlers must be coded. Double-click on the component to define the field structure. | |
| Report | The main object. Create one on a form and double-click to invoke the Report Designer. Assign the DataPipeline property so that the report can traverse data. Assign the DeviceType property to control where the output of the report is directed. | |
| Viewer | This object is rarely used because you can replace ReportBuilder’s built-in print preview form with your own customized version very easily (check the Replacing the Print Preview Form section in Advanced Techniques). If you must use this component, an example is provided in the main report demo (\Demos\Reports\dmMain.pas directory.) | |
| ArchiveReader | After you print a report to an archive file (.raf extension), you can read and preview the file via this component. Just assign the ArchiveFileName to the file and call the Print method. In terms of displaying a report, this component works much the same as the Report component. |
In addition to the above components, the following components appear on theRBuilder tab of the Delphi component palette when you install ReportBuilder Professional and Enterprise:
| Component | Icon | Description |
|---|---|---|
| DataDictionary | Used by the QueryWizard component to convert raw table and field names into more usable aliases. This component is generally used only when you are creating an end-user reporting solution. | |
| Designer | Used when you want to deploy the Report Designer to your end users. See the End-User demo (Demos\EndUser directory). | |
| ReportExplorer | Used to provide a Windows Explorer-style interface to End-User Reporting solutions developed using ReportBuilder Pro. See the End-User demo (..Demos\EndUser\1. Report Explorer\ directory). |
The following components appear on the RBServer tab of the Delphi component palette when you install ReportBuilder Server:

| Component | Icon | Description |
|---|---|---|
| Report Server | Used to create a report server application. Encapsulates all of the functionality required to communicate with remote clients and execute reports on their behalf. | |
| Web Tier | Used to build web based reporting solutions. The web tier acts as a middle tier between web browser clients and the report server. It enables web browser clients to request and view reports generated by a report server application. | |
| Report Archive Volume | Represents a collection of report archives on the server. Used in a server application to enable clients to preview and print a collection of report archives. Dynamically generates catalog items for archives stored in a file directory structure or database table. | |
| Report Template Volume | Represents a collection of report templates on the server. The report templates may be stored in .rtm files or a database table. Used in a server application to enable clients to preview and print a collection of report templates. | |
| Report Explorer Volume | Represents a collection of reports stored in the report explorer database tables. Used in a server application to enable clients to preview and print a collection of reports stored in report explorer database tables. | |
| Client Report | A report component that communicates with a report server. Contains many of the same properties and methods that are used to print and preview via a standard TppReport component. | |
| Client Report Explorer | Provides a user-interface that enables client applications to browse, preview, and print reports residing on a report server. The interface is very similar to the Windows Explorer and to the TppReportExplorer used to build end-user applications. |
The following components appear on the Standard Component Palette of the Report Designer when you install ReportBuilder:
![]()
| Component | Icon | Description |
|---|---|---|
| Label | Displays text. Assign the Caption property to control the text value. You can have the label resize automatically to fit a changing caption if you set the AutoSize property to True. | |
| Memo | Prints multiple lines of plain text in a report. To set the value, assign a string list to the Lines property. To dynamically resize the memo during printing, set the Stretch property to True. Use the ShiftRelativeTo property to define dynamic relationships with other stretchable objects. | |
| RichText | Prints formatted text. To set the value, assign the RichText property or use the LoadFromFile or LoadFromRTFStream methods. Use the ShiftRelativeTo property to define dynamic relationships with other stretchable objects. At design-time you can use the ReportBuilder's built-in RTF Editor to load, modify, and save rich text data stored in files. | |
| SystemVariable | Displays common report information such as page number, page count, print date and time, date, time, etc. The type of information displayed is controlled by the VarType property. The format is controlled by the DisplayFormat property. | |
| Variable | Used for calculations via an Object Pascal event handler assigned to the OnCalc event or a RAP event handler assigned to the OnCalc event. Access the Calculations dialog (via the speed menu) or the Calc tab of the Report Designer to code a RAP calculation for this component. | |
| Image | Displays bitmaps and windows metafiles in reports. Assign the Picture property of this component in order to place an image in your report. Use the Report Designer's built-in picture dialog to load images at design-time. | |
| Shape | Prints various shapes (squares, rectangles, circles, ellipses). Set the Shape property to select a type of shape. Use the Brush and Pen properties to control the color and border respectively. | |
| Line | Displays single and double lines (either vertical or horizontal.) Set the Style property to control whether the line is single or double. Set the Weight property to control the line thickness in points. Set the Position property to control whether the line is vertical or horizontal. | |
| TeeChart | Displays standard (non-data-aware) TeeCharts. This component enables you to use TeeCharts inside the Report Designer. You can access the TeeChart editor via a popup menu. | |
| BarCode | Renders barcodes. The string value assigned to the Data property is encoded based on the BarCodeType. If the data to be encoded is in a database, use DBBarCode. The following symbologies are supported: Codabar, Code 128, Code 39, EAN-13, EAN-8, FIM A,B,C, Interleaved 2 of 5, PostNet, UPC-A, UPC-E. |
|
| 2DBarCode | ||
| CheckBox | Displays a checkbox using the WingDings font. |
The following components appear on the Data Component Palette of the Report Designer when you install ReportBuilder:
![]()
| Component | Icon | Description |
|---|---|---|
| DBText | Displays values from all types of database fields. Use the DisplayFormat property to format the value. | |
| DBMemo | Prints plain text from a memo field of a database table. This control will automatically word-wrap the text. Set the Stretch property to True and the component will dynamically resize to print all of the text. Use the ShiftRelativeTo property to define dynamic relationships with other stretchable objects. | |
| DBRichText | Prints formatted text from a memo or BLOB field of a database table. This control will automatically word-wrap the text. Set the Stretch property to True and the component will dynamically resize to print all of the text. Use the ShiftRelativeTo property to define dynamic relationships with other stretchable objects. | |
| DBCalc | Used for simple database calculations (Sum, Min, Max, Count and Average). The value can be reset when a group breaks using the ResetGroup property. | |
| DBImage | Prints bitmaps or windows metafiles, which are stored in a database BLOB field. | |
| DBBarCode | Renders barcodes based on the BarCodeType and the value supplied via the DataField property. The following symbologies are supported: Codabar, Code 128, Code 39, EAN-13, EAN-8, FIM A,B,C, Interleaved 2 of 5, PostNet, UPC-A, UPC-E. | |
| DB2DBarCode | ||
| DBTeeChart | Allows data-aware TeeCharts to be placed within a report. | |
| DBCheckBox | Displays a checkbox based on the value of the field specified in the DataField property. Can be used with a Boolean field (or any other type of field via the BooleanTrue, BooleanFalse properties). |
The following components appear on the Advanced Component Palette of the Report Designer when you install ReportBuilder:
![]()
| Component | Icon | Description |
|---|---|---|
| Region | Logically groups components together. Use the ShiftRelativeTo property to move the region in relation to another dynamically resizing component (such as Memo, RichText or child-type SubReport). | |
| SubReport | Handles multiple master details, create side-by-side reporting effects, and hook reports together as one. If you need a report to print within the context of a band, use a child-type subreport. If you need to hook reports together, use a section type subreport. The PrintBehavior property determines the subreport type. | |
| Page Break | Allows the user to force a new page during report generation. Placing a TppPageBreak component on a report will cause all objects created after the PageBreak (Z-Order) to be moved to the next page in the report relative to the PageBreak object's top position. | |
| CrossTab | Displays calculated values in a multi-dimensional grid format. Columns, Rows and Values can be defined. |